Introduction
To create maps that help contextualize a scene, news rooms often appeal to annotation layers added atop 3d earth imagery. In this tutorial, we will use Google Earth Pro and Adobe Illustrator to recreate two graphics used by the NYTimes – one accompanying a story on the DMZ and one for a story on the Hong Kong protests. The full articles can be found at:
The images we will be replicating are those seen below:
| Demilitarized Zone | Hong Kong |
|---|---|
 |
 |
Google Earth Pro Setup
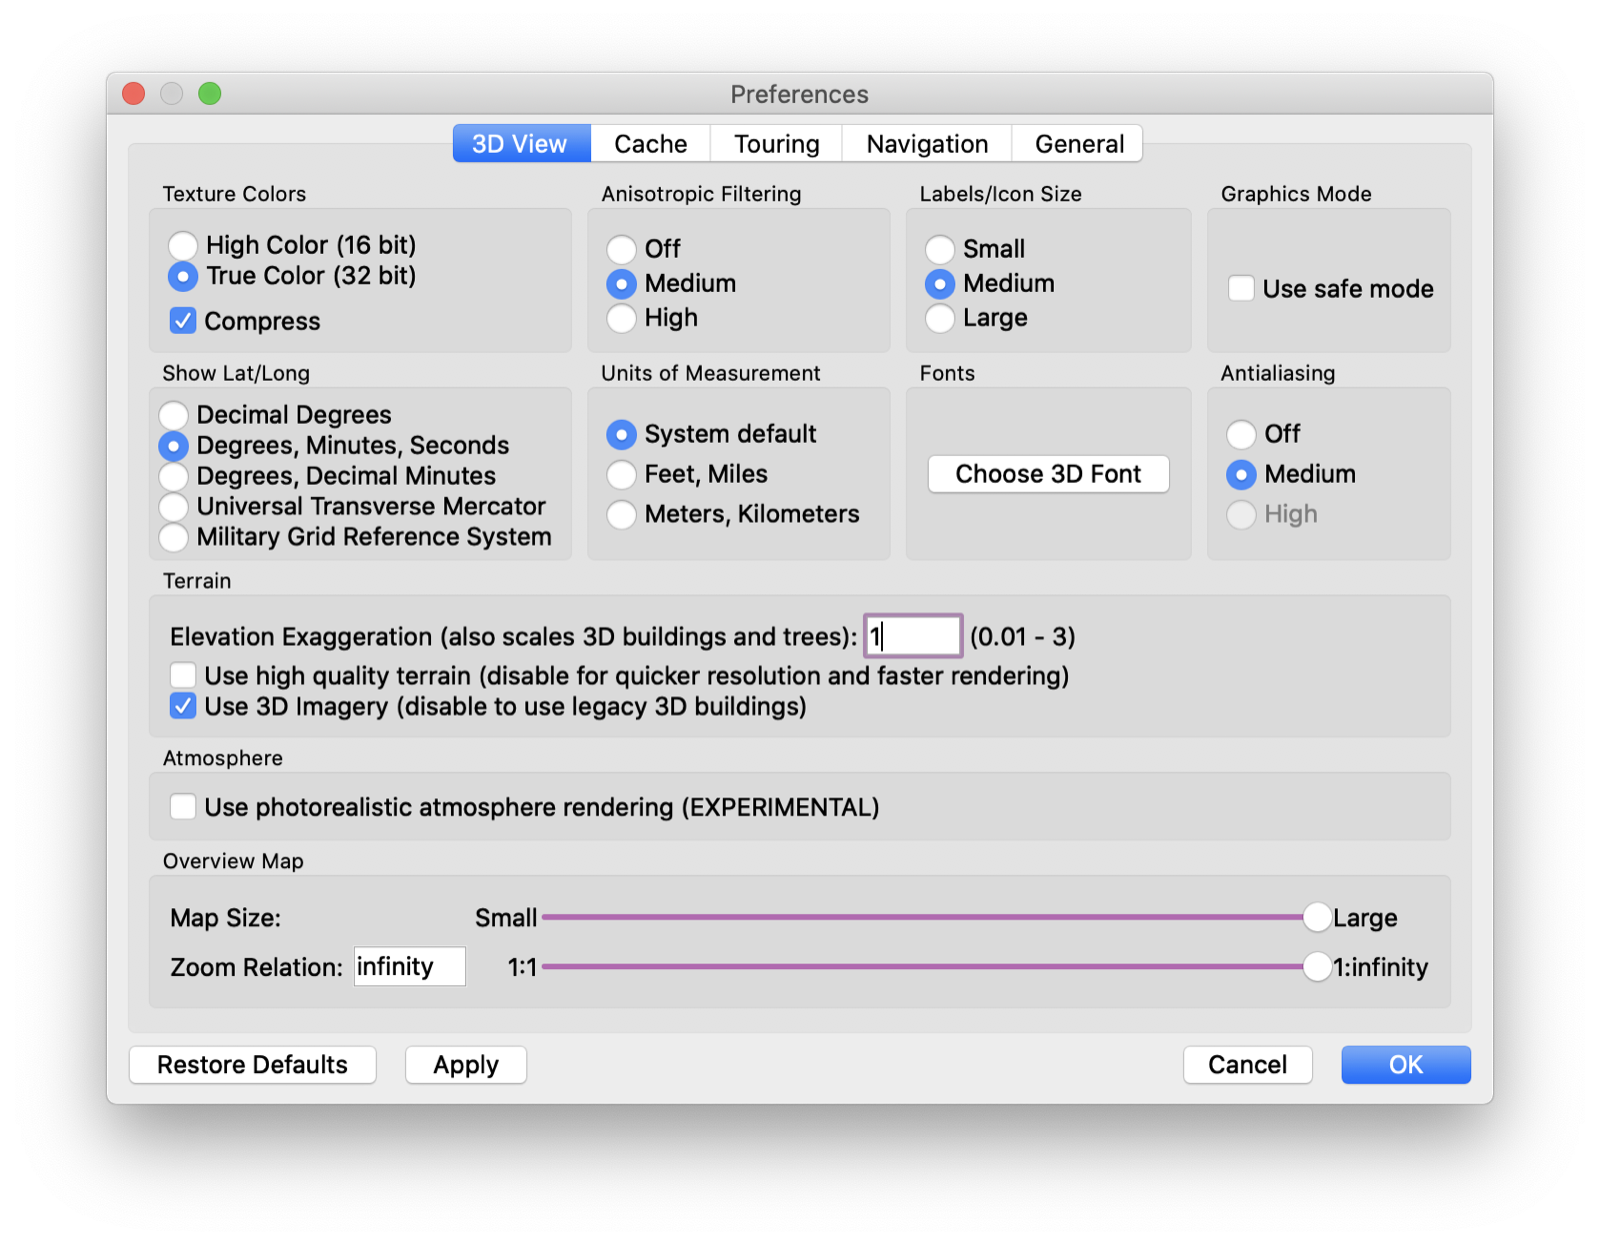
After installing Google Earth Pro, navigate to your preferences and make sure that Use high quality terrain is disabled. The remaining settings can remain untouched.
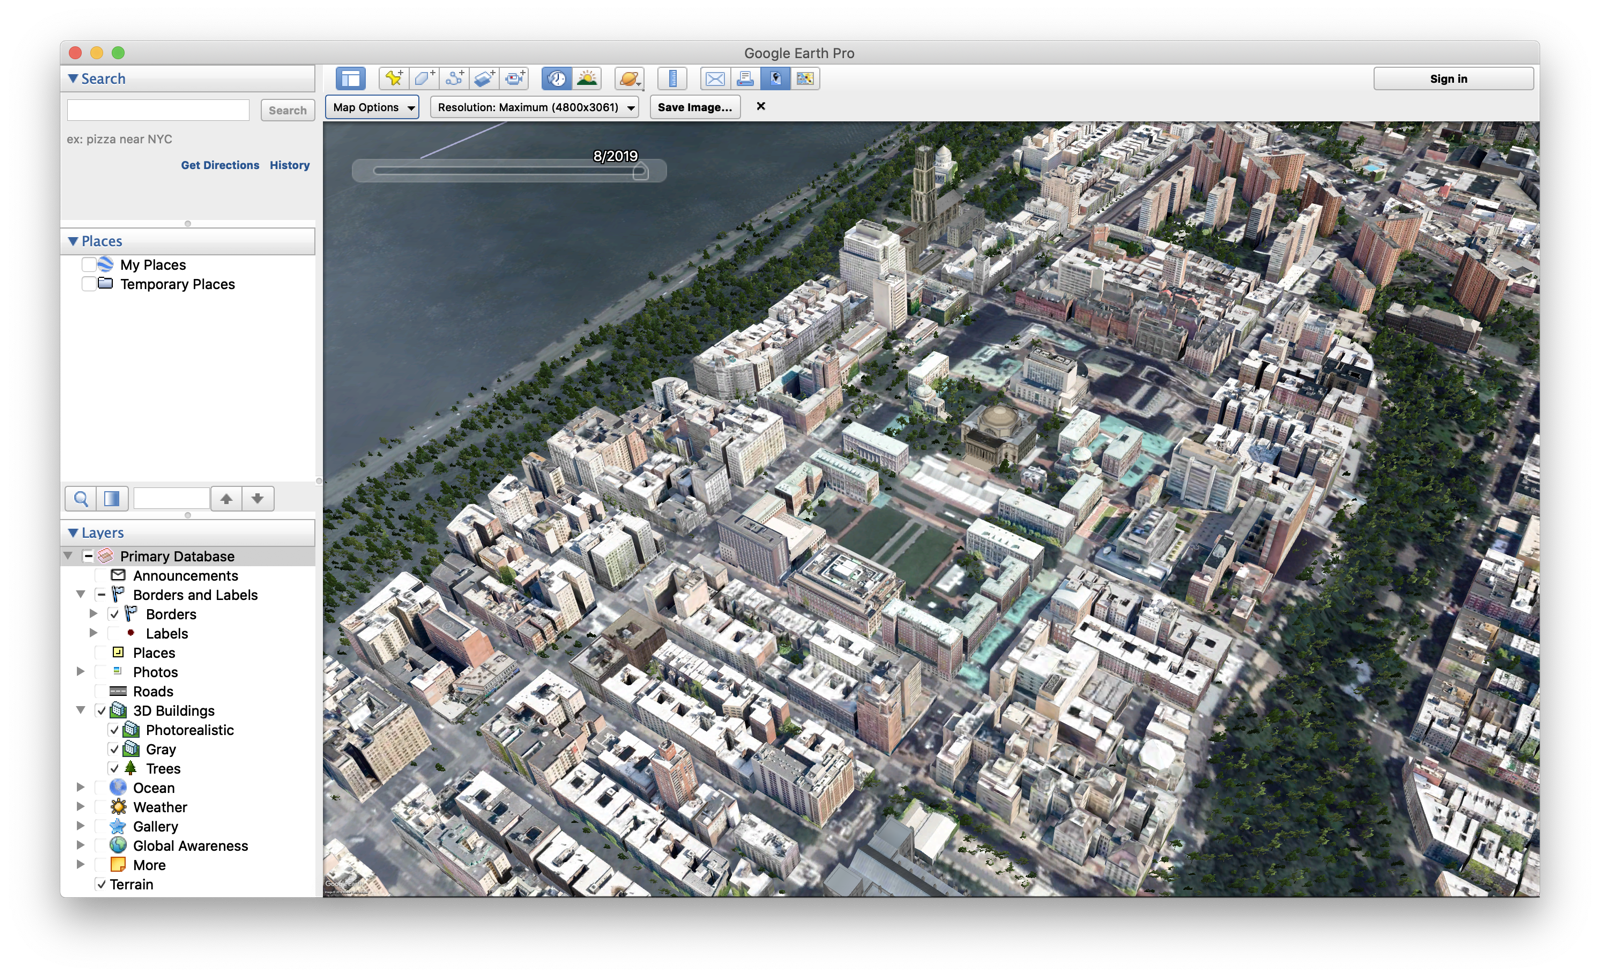
The next step is ensuring a clean workspace for you to navigate earth imagery. By default, Google Earth Pro starts with most layers enabled. Navigate to your layers panel on the left-hand toolbar and disable all layers except Borders, 3D Buildings, and Terrain.
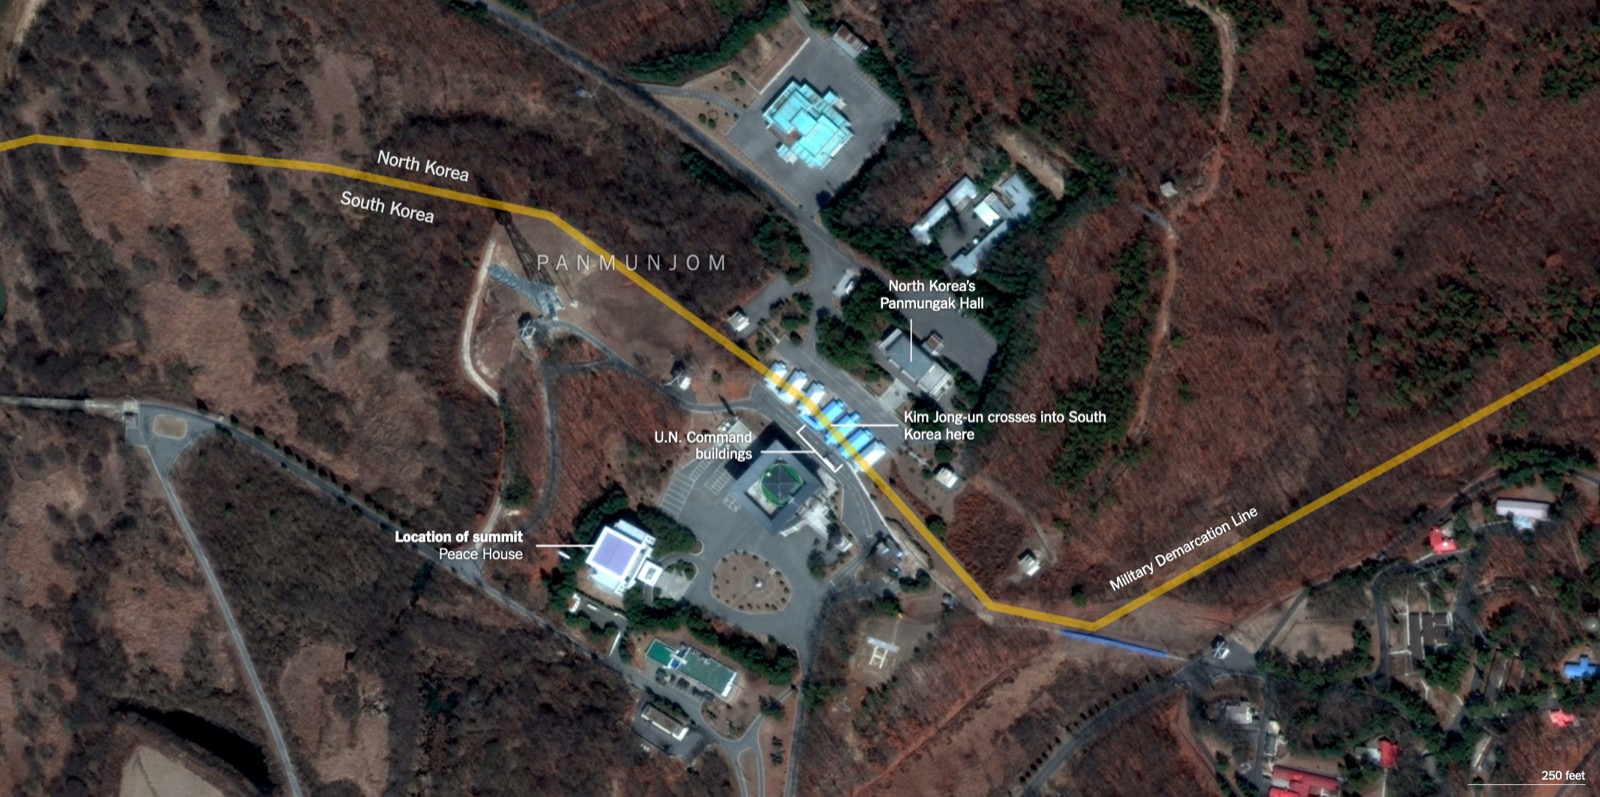
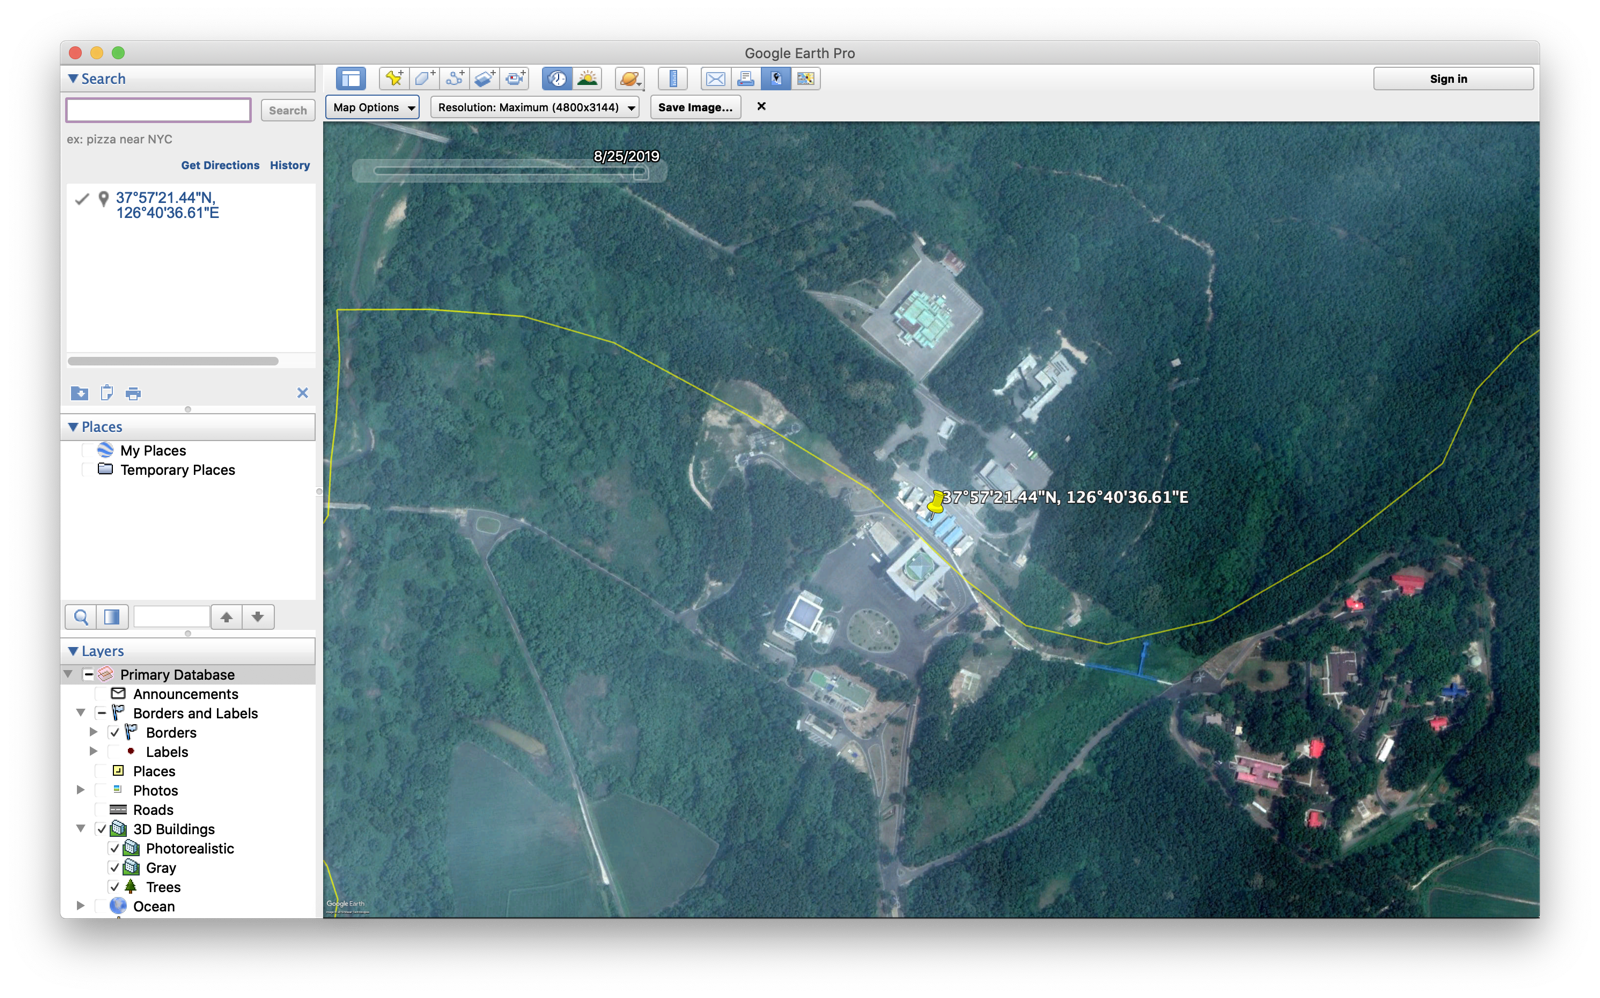
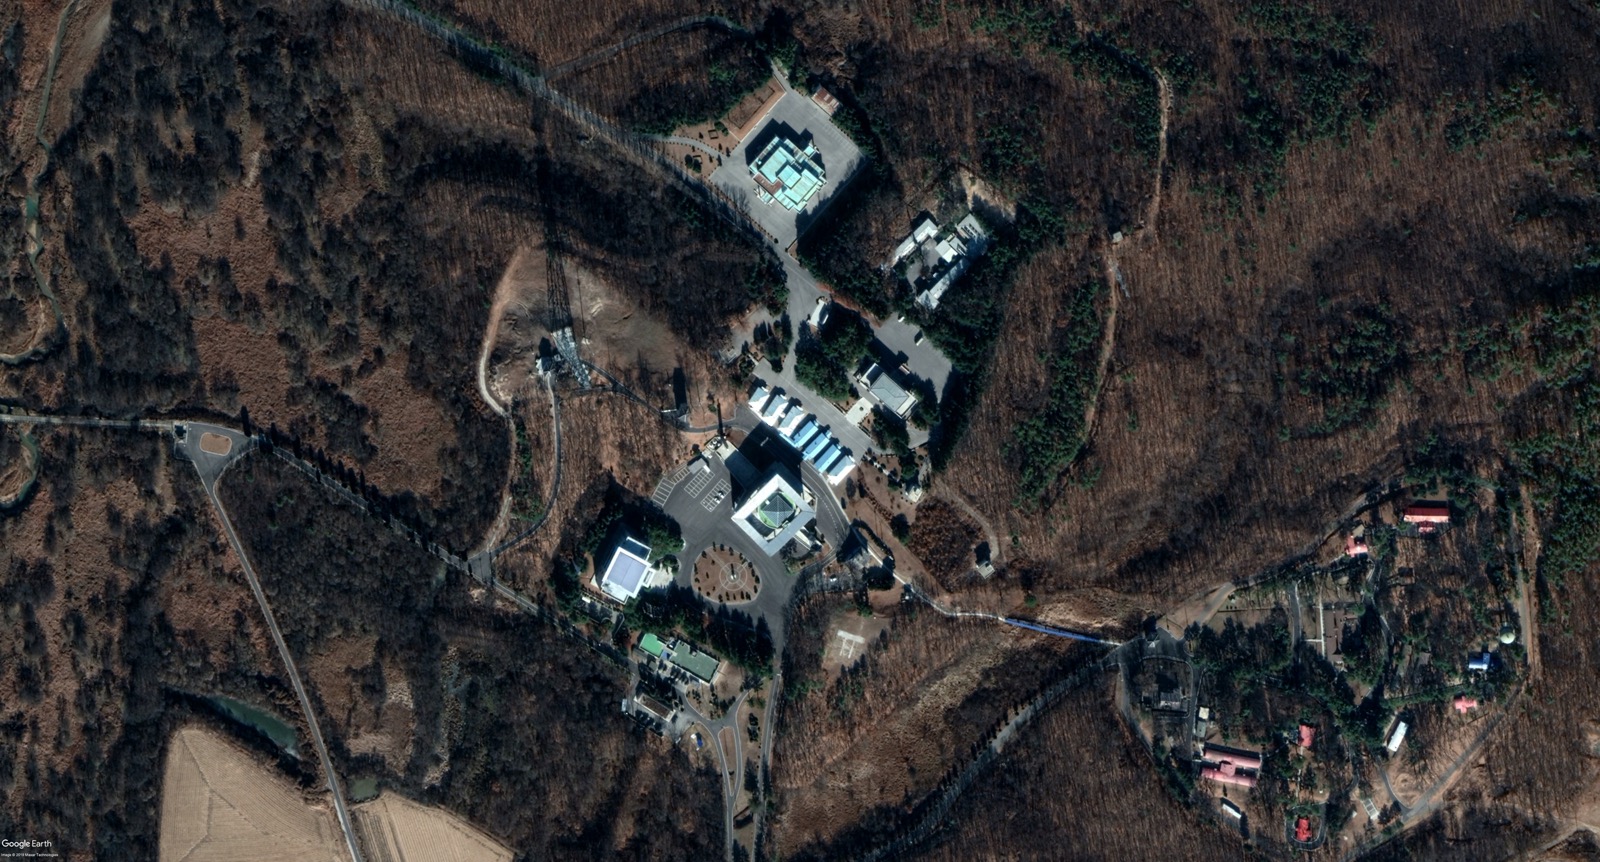
We will start by downloading imagery of the DMZ. To get an image that can be brought into Adobe Illustrator for annotation, search for the DMZ using the following latitude and longitude: 37°57'21.44"N, 126°40'36.61"E.
By default, Google Earth Pro will surface the most recent imagery available. At the time of writing this tutorial, the imagery is from 8/25/2019 and includes moderate cloud cover.
Finding Your Imagery
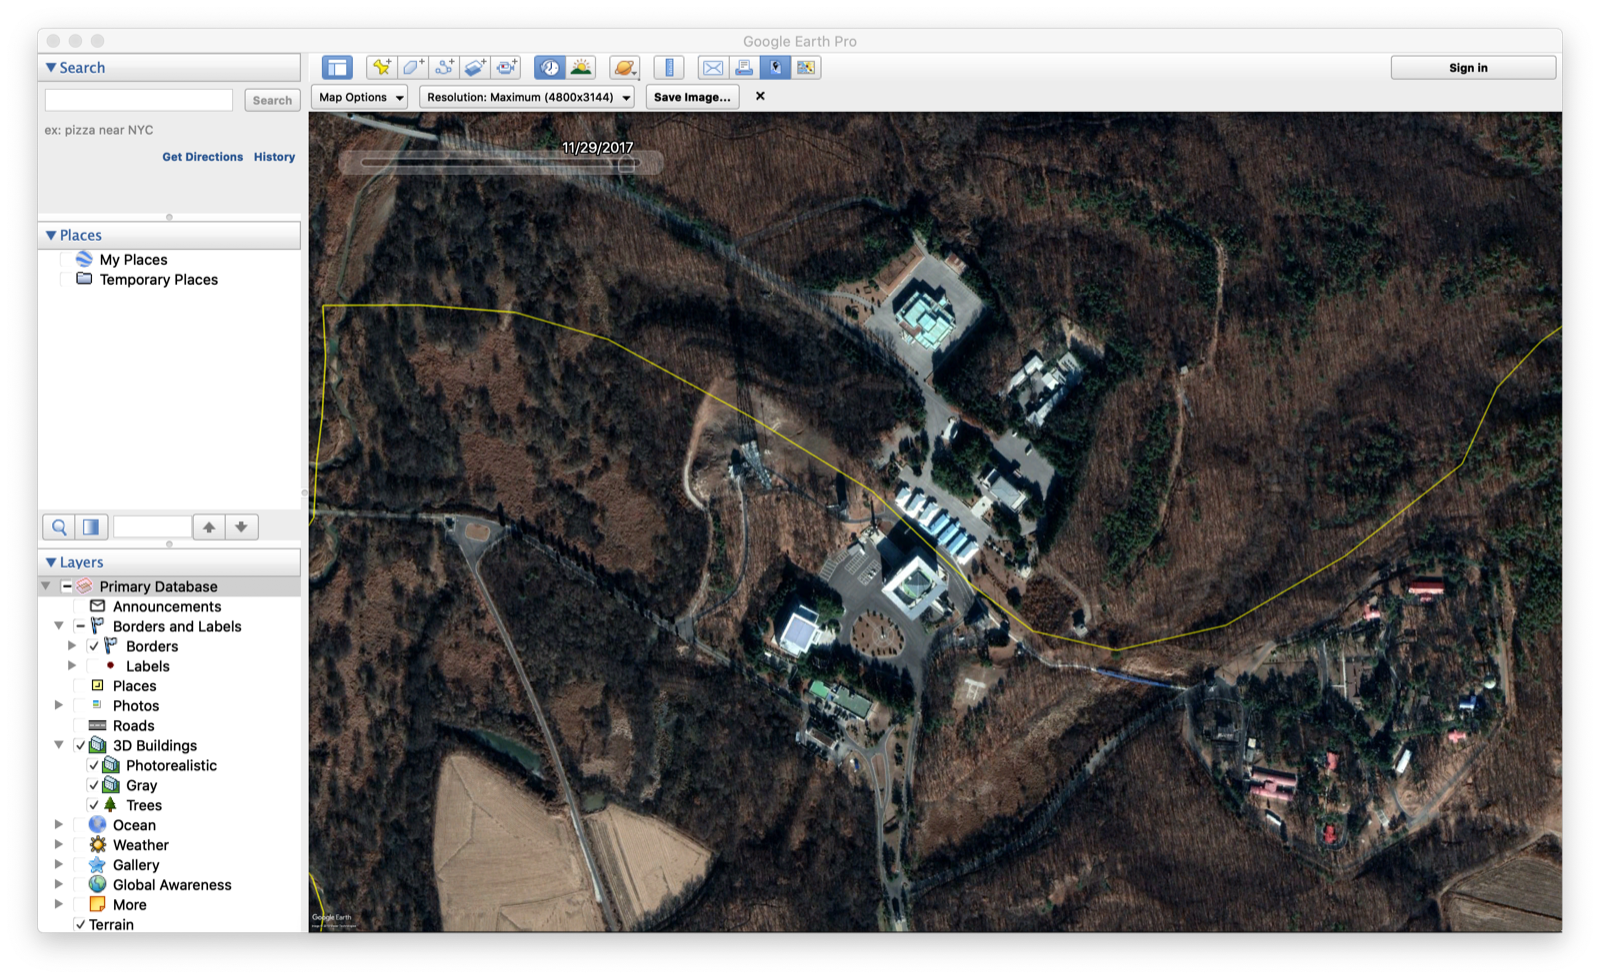
Start by scrolling back through time to either the specific date of your story, or to the most recent image that isn’t hindered by cloud cover. In this case, the image comes from satellite imagery captured on 11/29/2017. If you do not see the history slider, simply click on the clock icon from the upper toolbar.
In Illustrator, we will want to work with this image without any borders or labels. That said, we will need a reference image with the border enabled. Begin by deleting your search result. This will remove the pin found on the center of your screen. Next, select the overlay icon to hide the left-hand toolbar.
Exporting Your Imagery
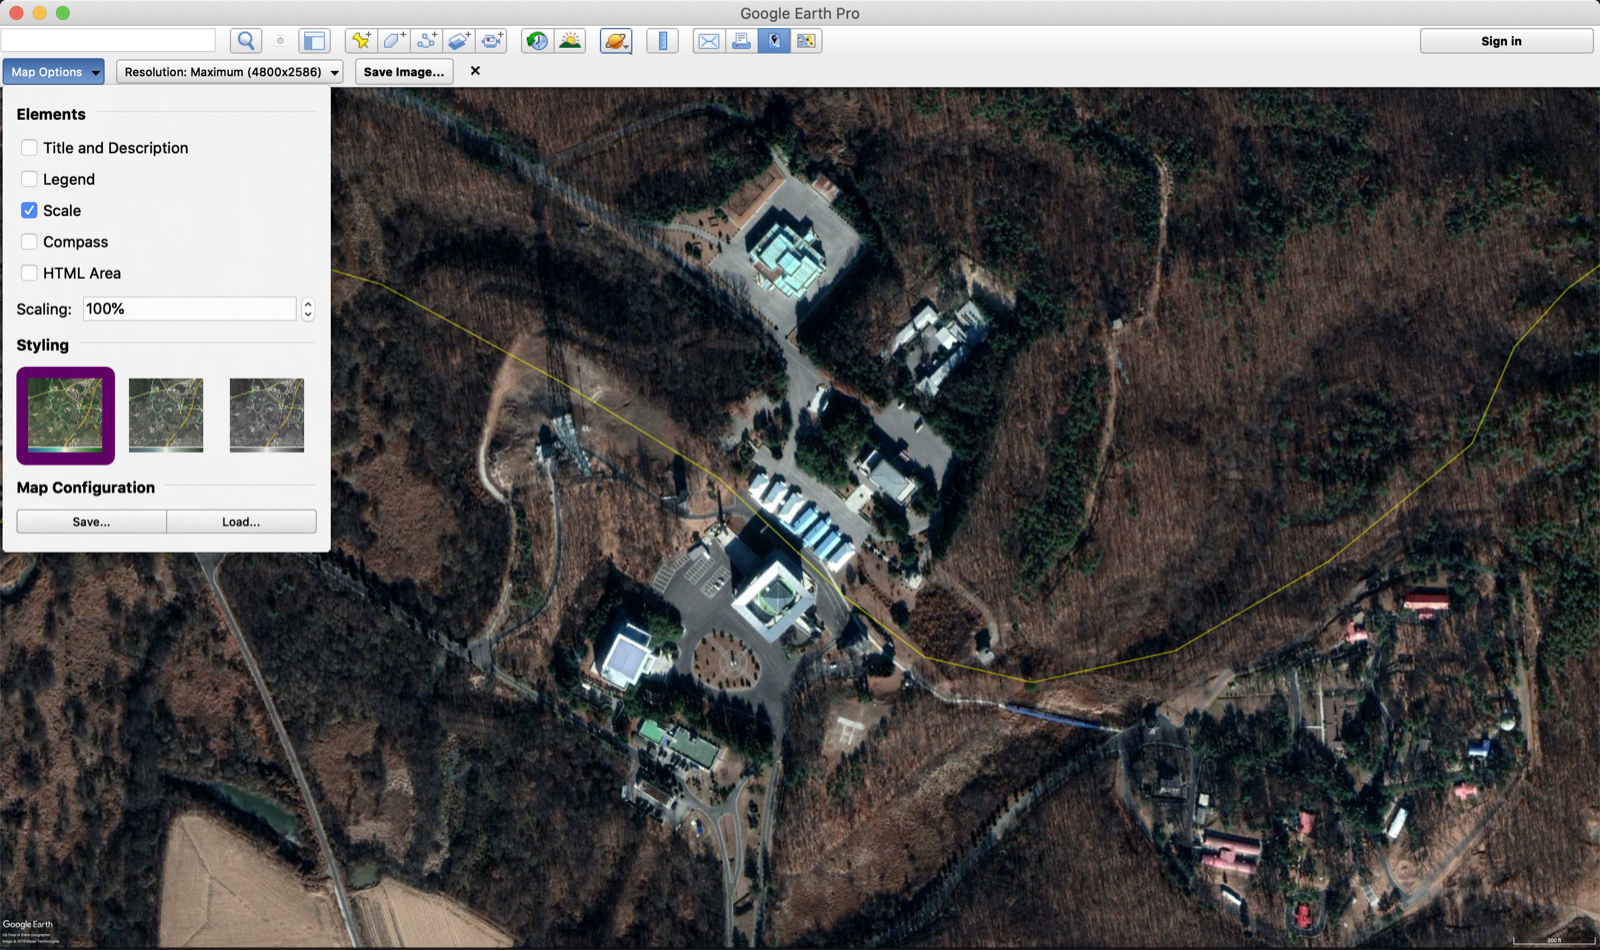
To save the image, select the Save Image icon. Set the resolution to Maximum and select scale so that we are able to provide the reader with a reference value. Next, click Save Image and we will save this as dmz-with-reference.jpg.

Next, we will export an image for us to annotate. To do so, open your left-hand sidebar and disable Borders from the Layers panel. Close the sidebar, and under Save Image, disable Scale. Now, save the image as dmz-without-reference.jpg.
Now, we are ready to import these files into Adobe Illustrator.
Importing into Illustrator and Setting up the Image
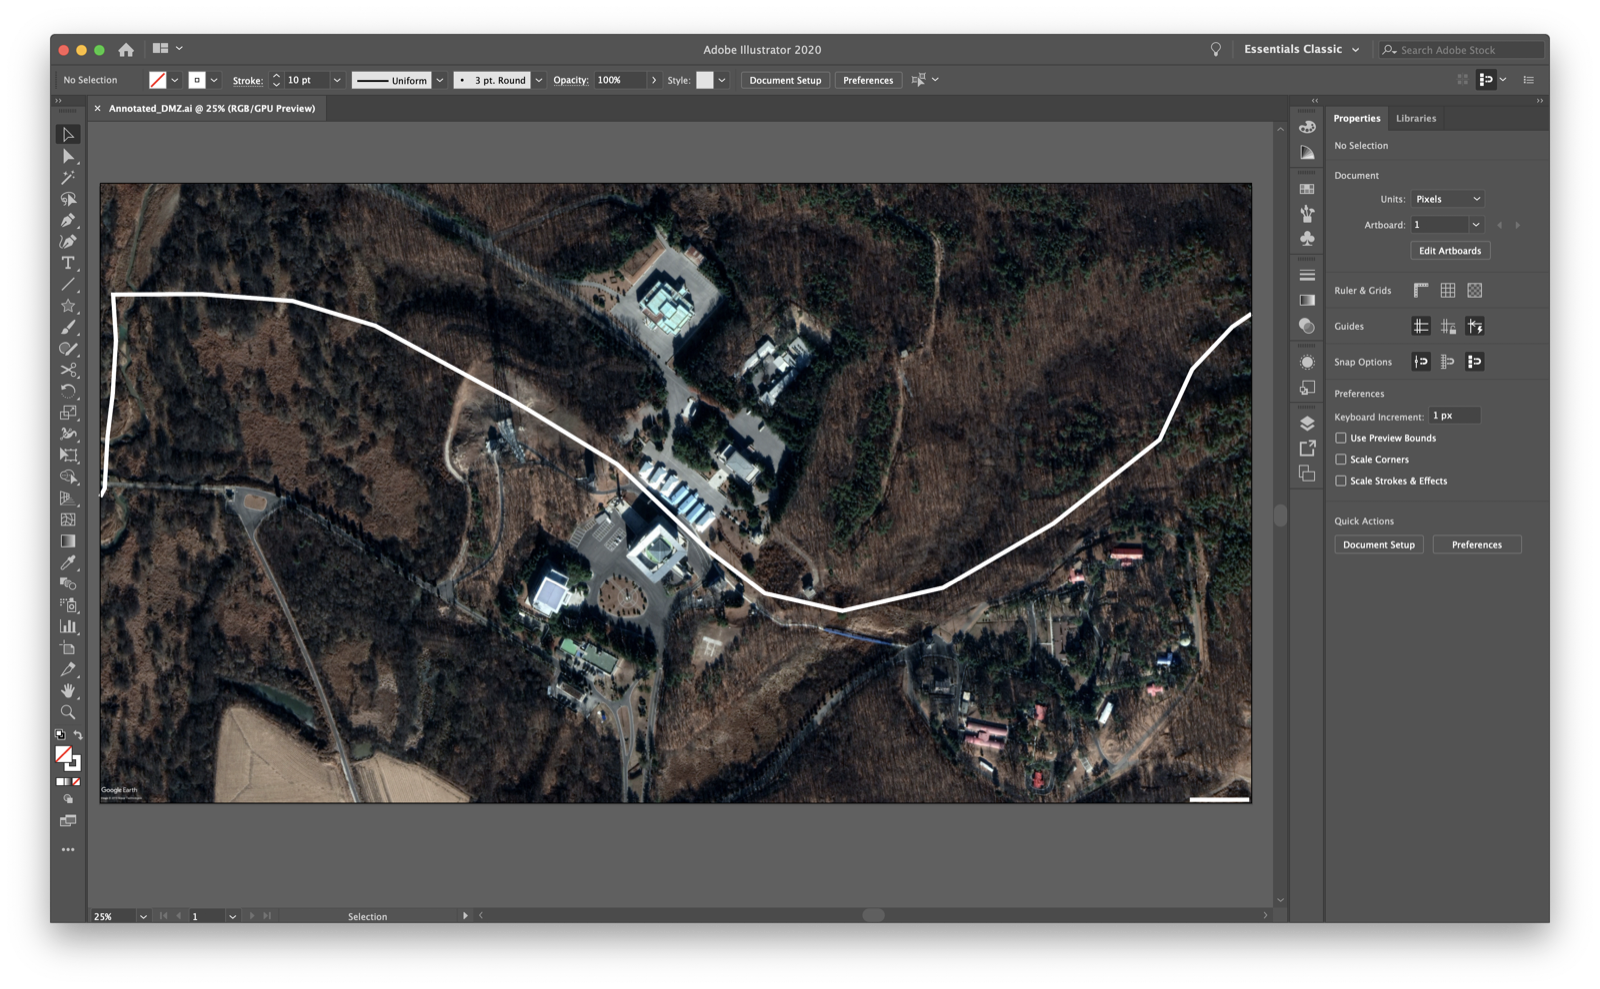
Start by creating a new document that has dimensions of 2880 x 1440. Next, navigate to File -> Place, and select your dmz-without-reference.jpg file. Place the file into the scene, and with the image still selected, transform the image using a locked aspect ratio to 1440px x 2880px. Now, also place and resize the dmz-with-reference.jpg so that it directly overlaps with the other image. In your upper toolbar, navigate to Window -> Workspace -> Essentials Classic. Finally, save your Adobe Illustrator File into your working directory.
To begin, we will need to trace the border between North and South Korea. To do so, select the Pen Tool either using the lefthand toolbar or by pressing P on your keyboard. Zoom into the image (Command + +), and trace along the border line seen on your image. Next, zoom in and trace along the scalebar in the lower right-hand portion of your screen. Increase the Stroke of each line to 10pt and set the stroke to White so that it is easy to work with. Now, click anywhere on the top layer (dmz-with-reference.jpg) and click Delete.
Now, we can style the image and add all remaining annotations. Start by adding all text found on the image. To add text, press T on your keyboard or select the Text Tool on the lefthand toolbar. This should populate a new set of options on your righthand toolbar, including font and font color. We will make all text white (#ffffff) and will use Helvetica Regular or Helvetica Bold for all text. Use the New York Times image as a reference, indicating where text should be rotated, bold, or italic. Add all text to your image. When annotating buildings, use the line tool (\) to draw a line away from the building to your text.
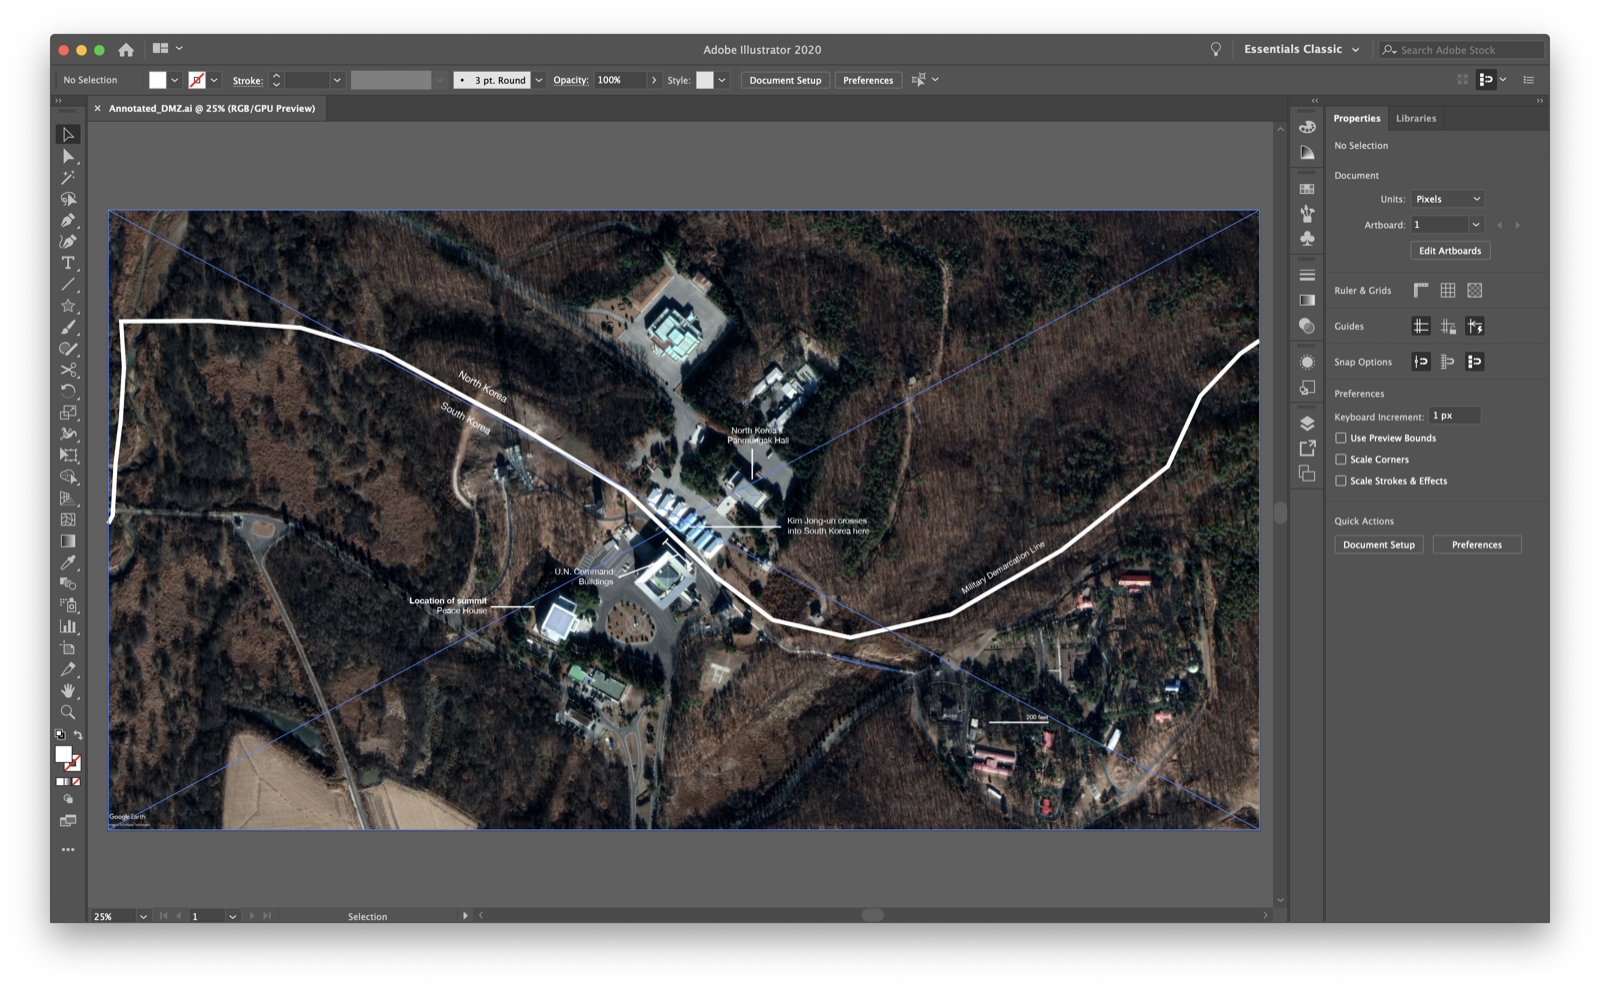
To conclude, we will resize the artboard to focus on the areas of interest, exporting the final image. Were we to be publishing this online, we would export this using AI2HTML, a script produced by the New York Times to make annotations machine-readable.
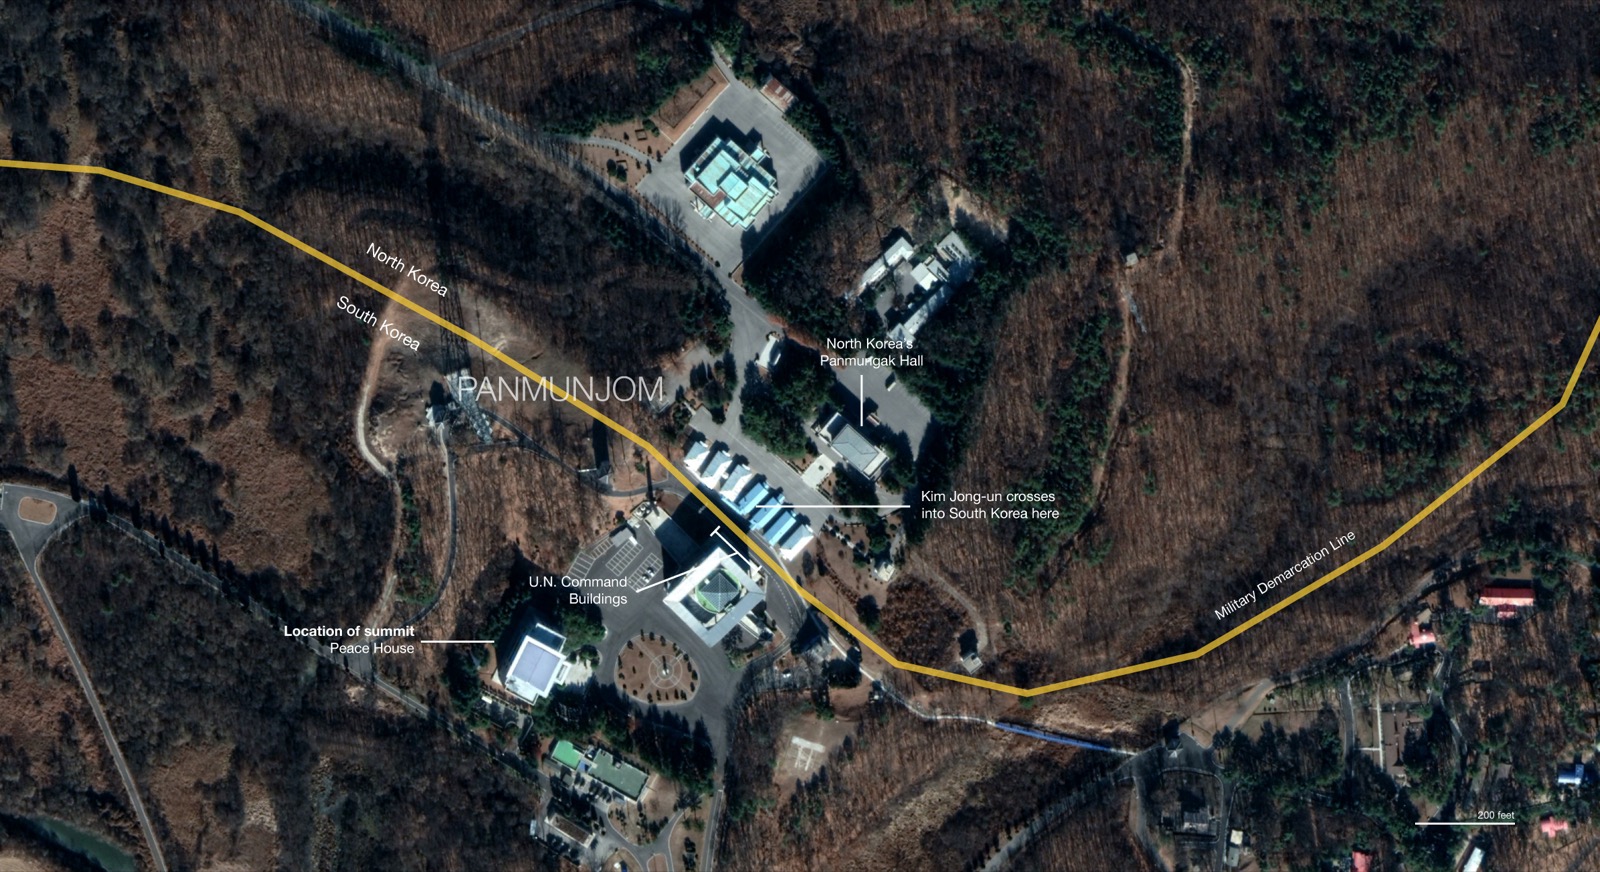
As you’ll note, this border varies from the New York Times. Always consult official sources when representing something as official as a border. Especially in controversial zones such as the Joint Security Area of the DMZ. In this instance, Google Maps does not have the border accurately placed. For the purposes of this demonstration, we will leave the border as identified by Google.
Advanced Annotated 3D Maps - The Hong Kong protests
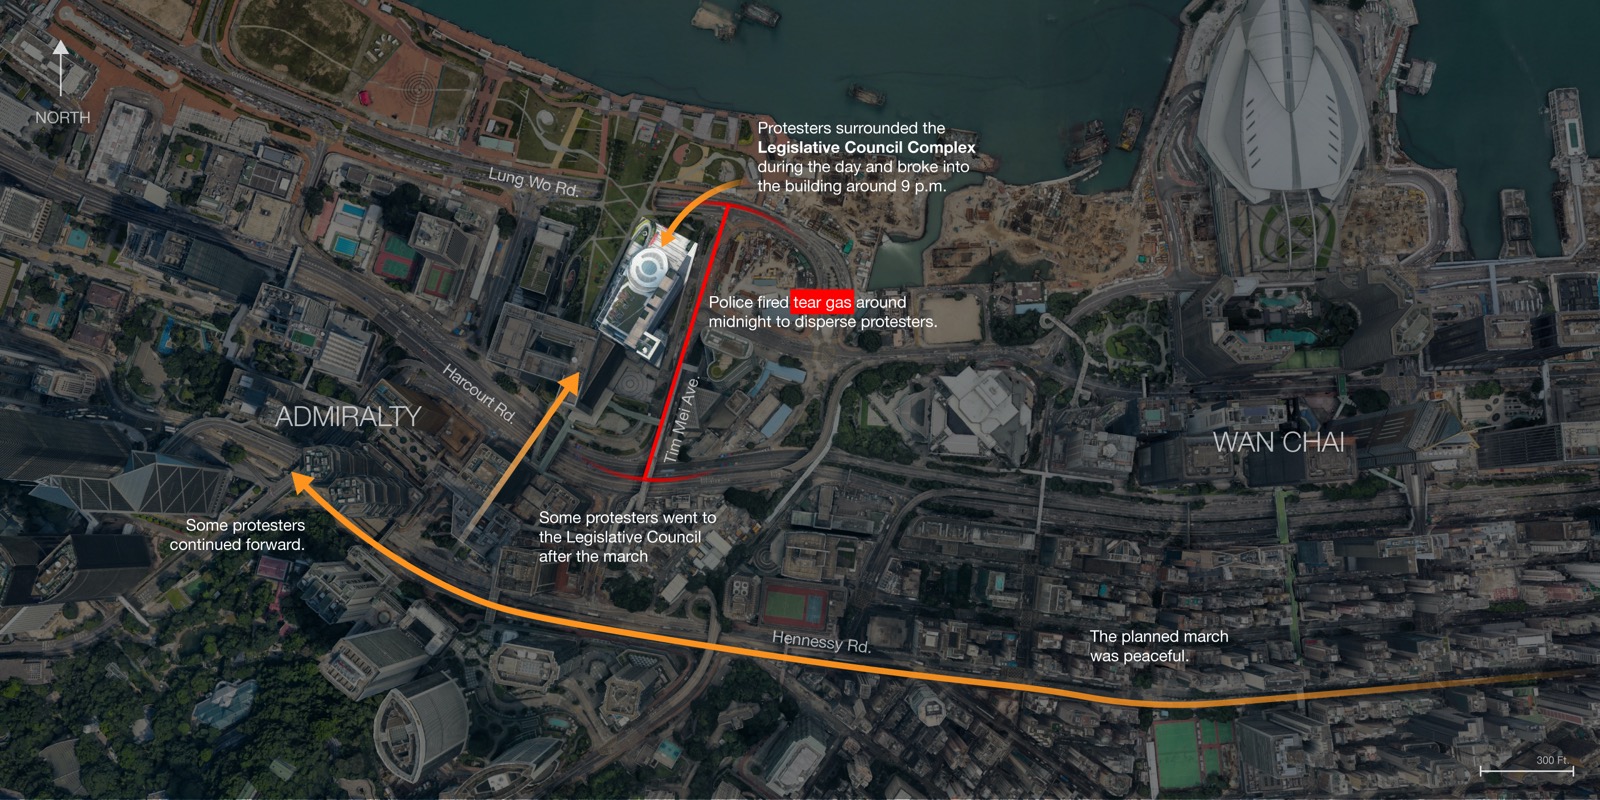
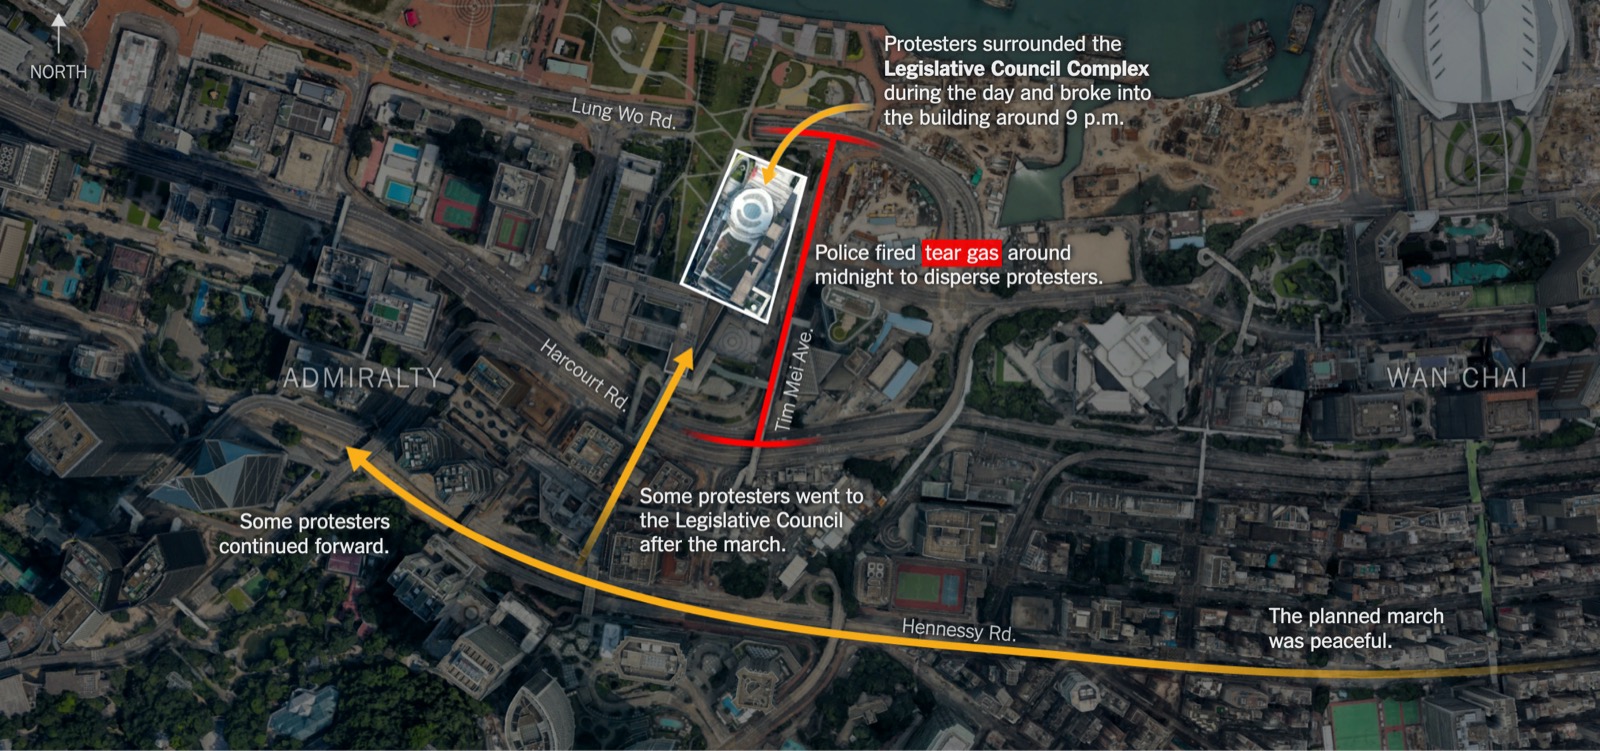
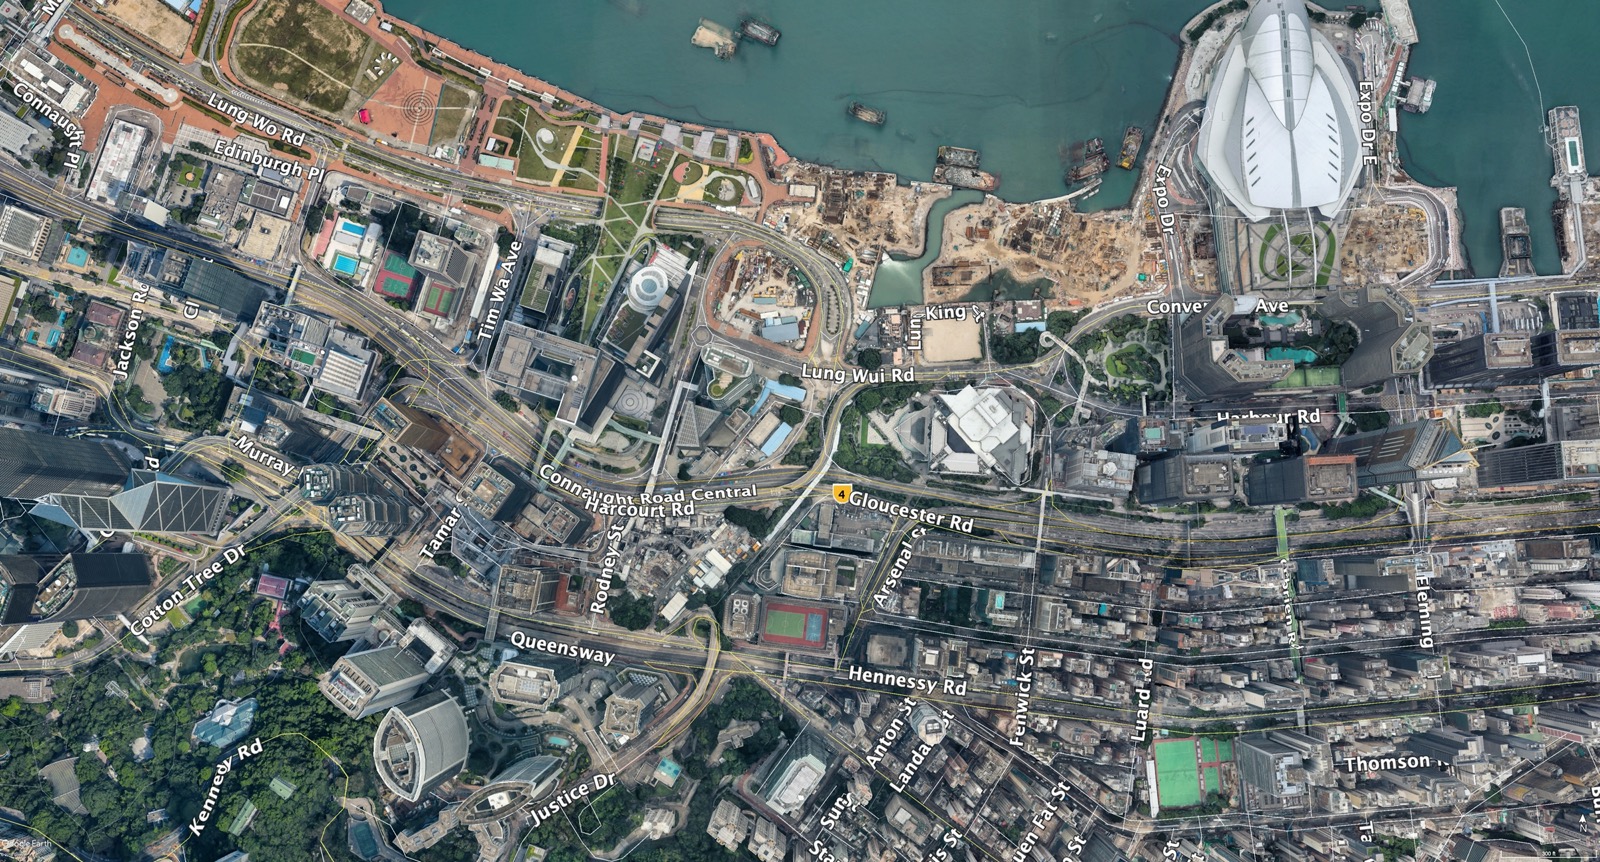
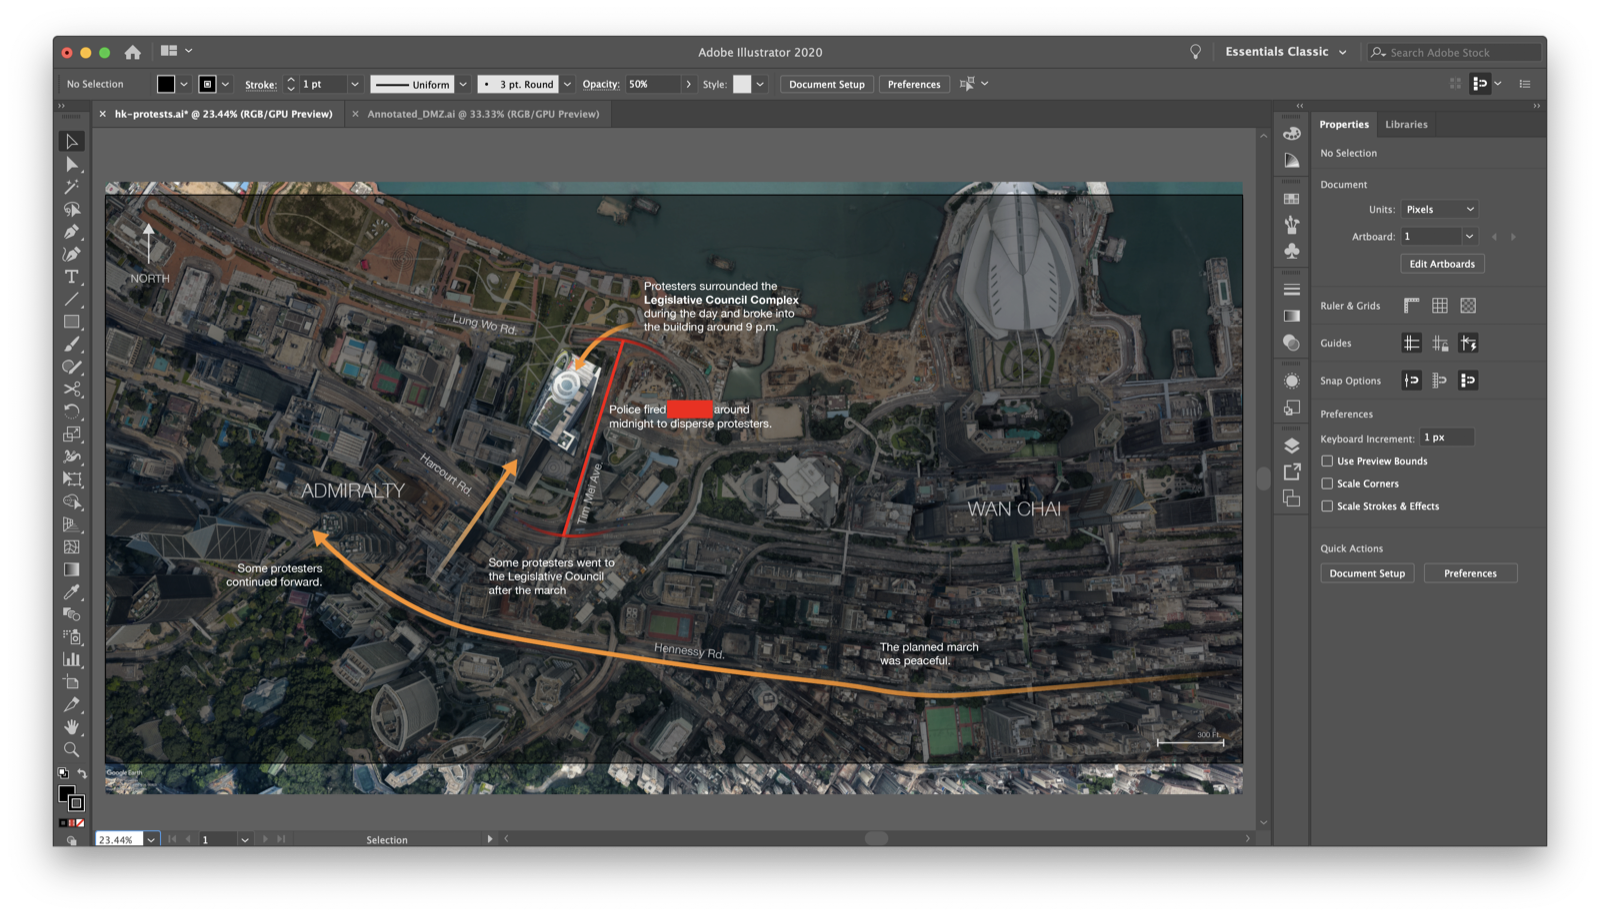
The second map we will recreate comes from the New York Times in an article Hong Kong Protests: Mapping Where Police and Crowds Clashed, which provided a handful of annotated reference maps. The above map is what this tutorial will recreate.
3D annotated maps are often used when motion is needed to be depicted on a spatial plane. In this instance, the map highlights the movement of protestors. This is also why annotated maps are often used to reconstruct crime scenes such as terrorist events and natural disasters. Another advantage to 3D maps is that they are great in depicting terrain and cities. In this instance, it is clear that the protests are happening in a major metropolitan area.
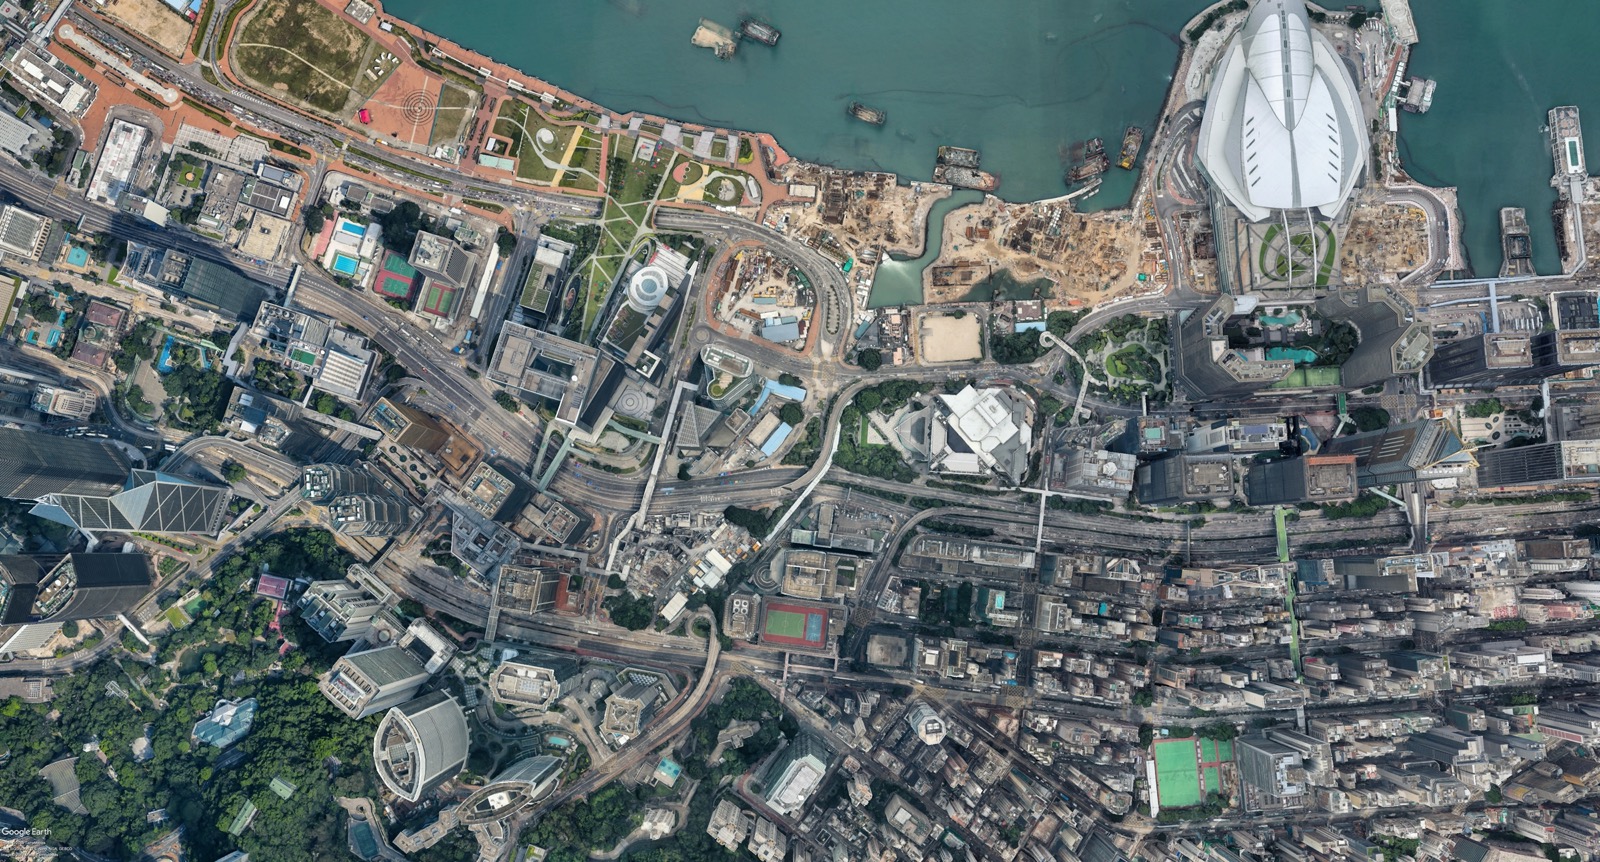
Begin by working in Google Earth Pro to find the downtown protest area seen in the article. If you have trouble finding the location, search the following latitude and longitude - 22°16'47.08"N, 114°10'5.07"E. Like before, save two images to your computer – one including street names (accomplished by enabling Roads in the lefthand toolbar), a scale bar, and a compass. In addition, export an image that is just the satellite imagery without any labels or references.
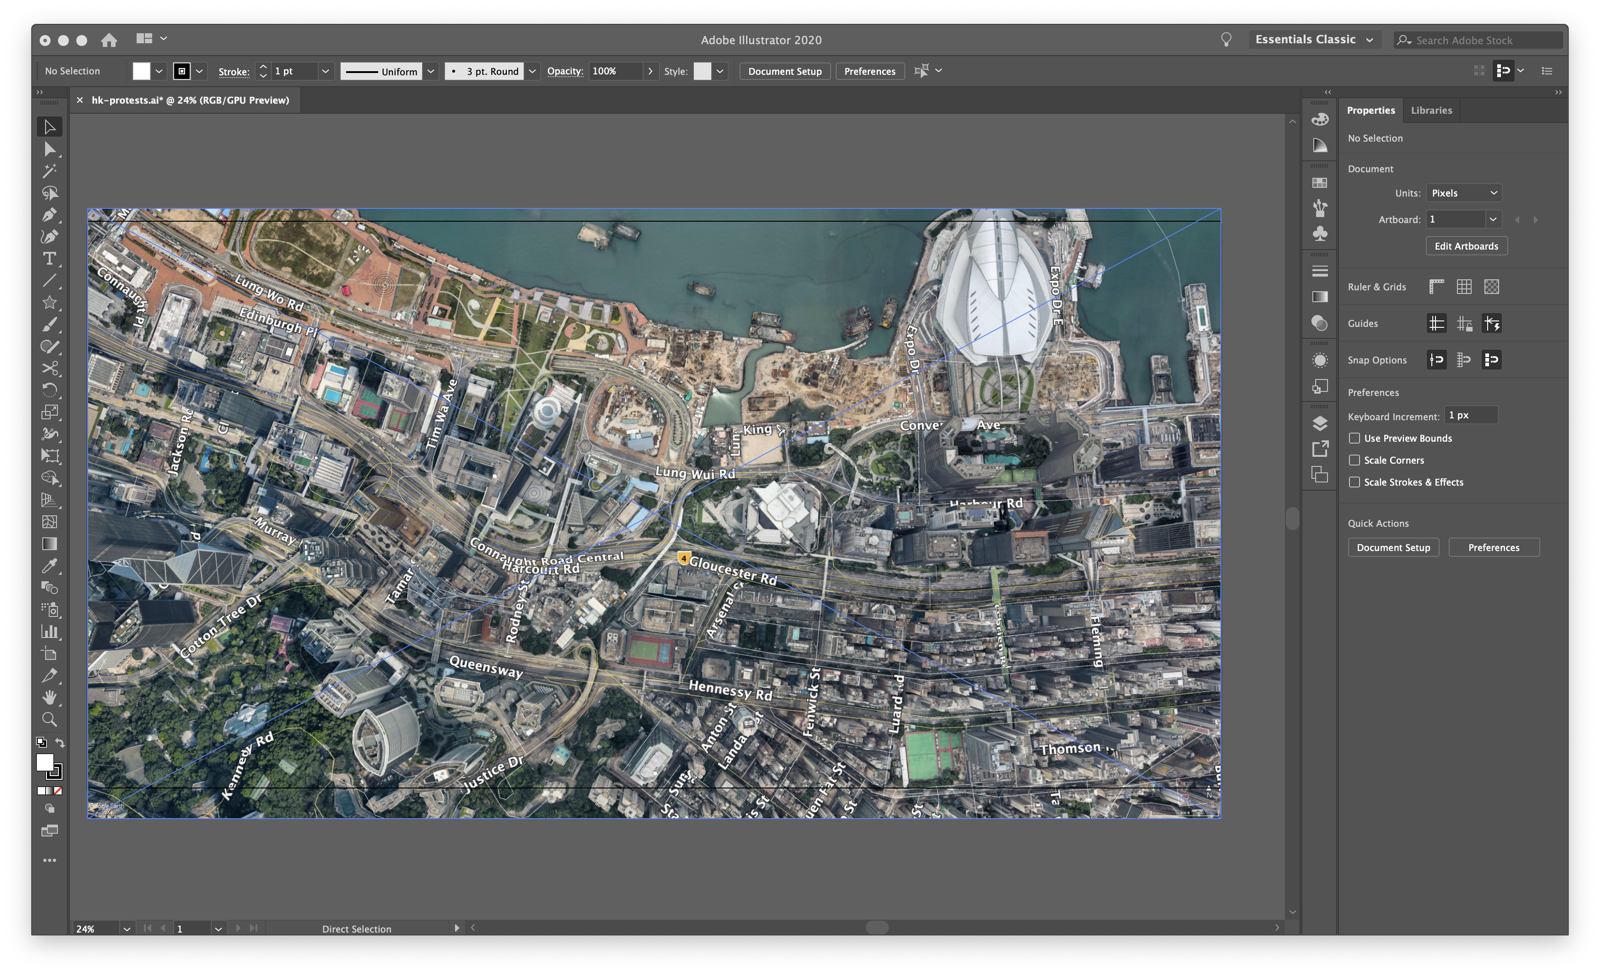
Like before, create an artboard in Adobe Illustrator with the dimensions of 1440px x 2880px and place both images, with the image without labels being placed first (bottom layer).
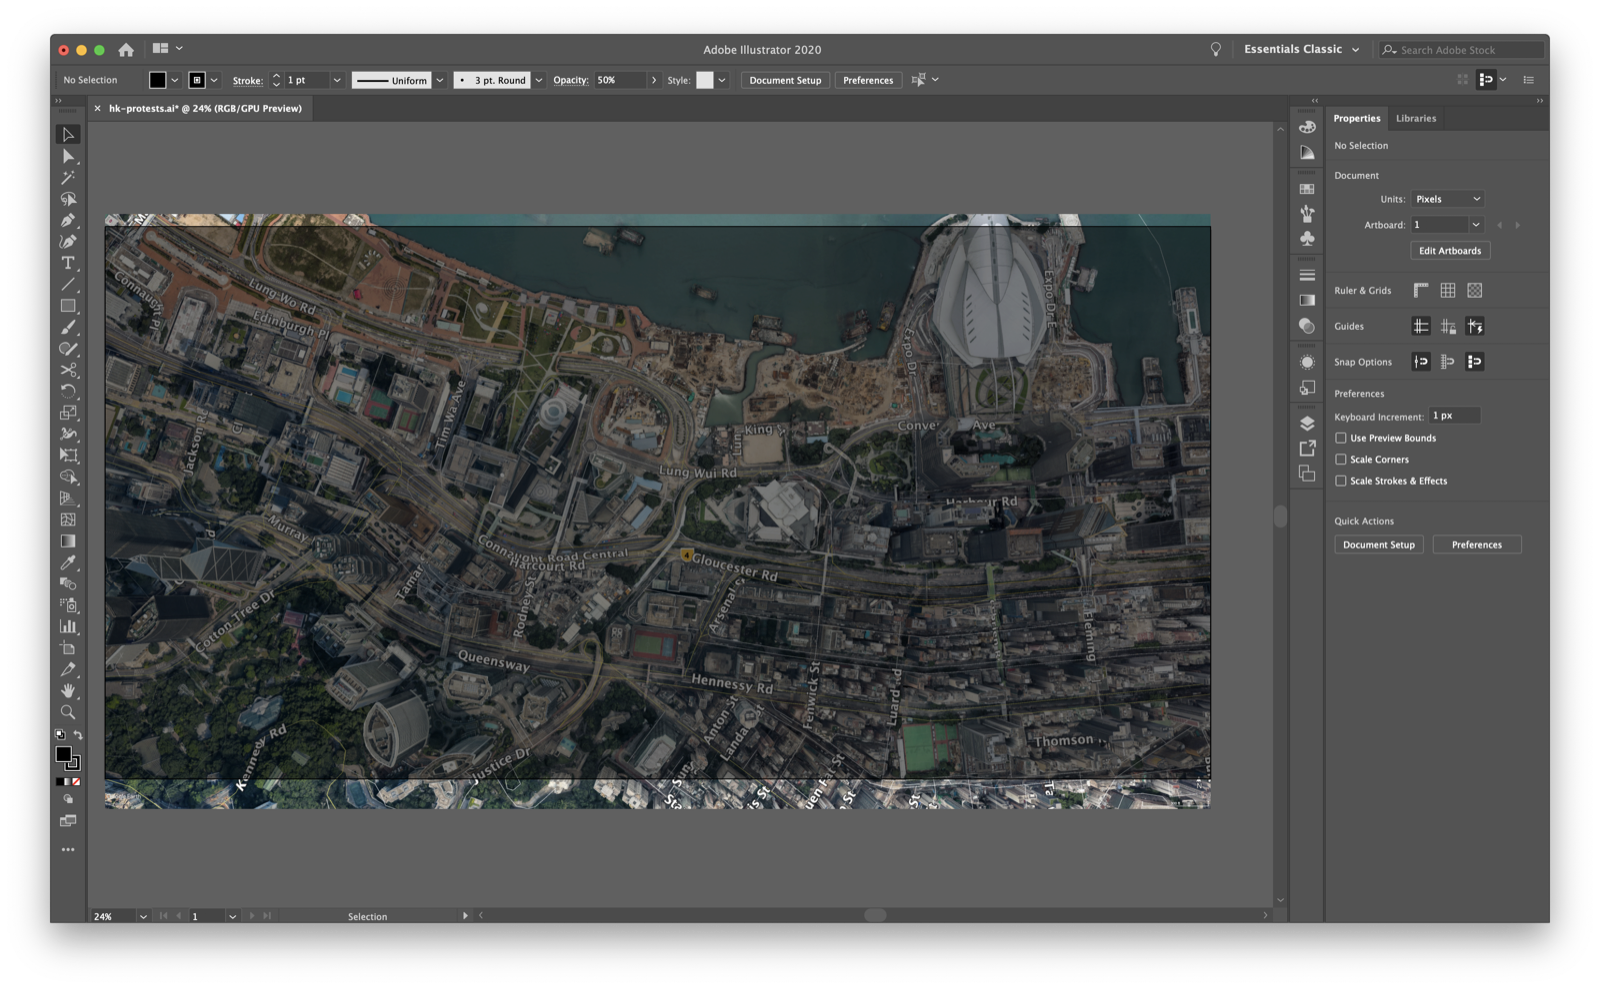
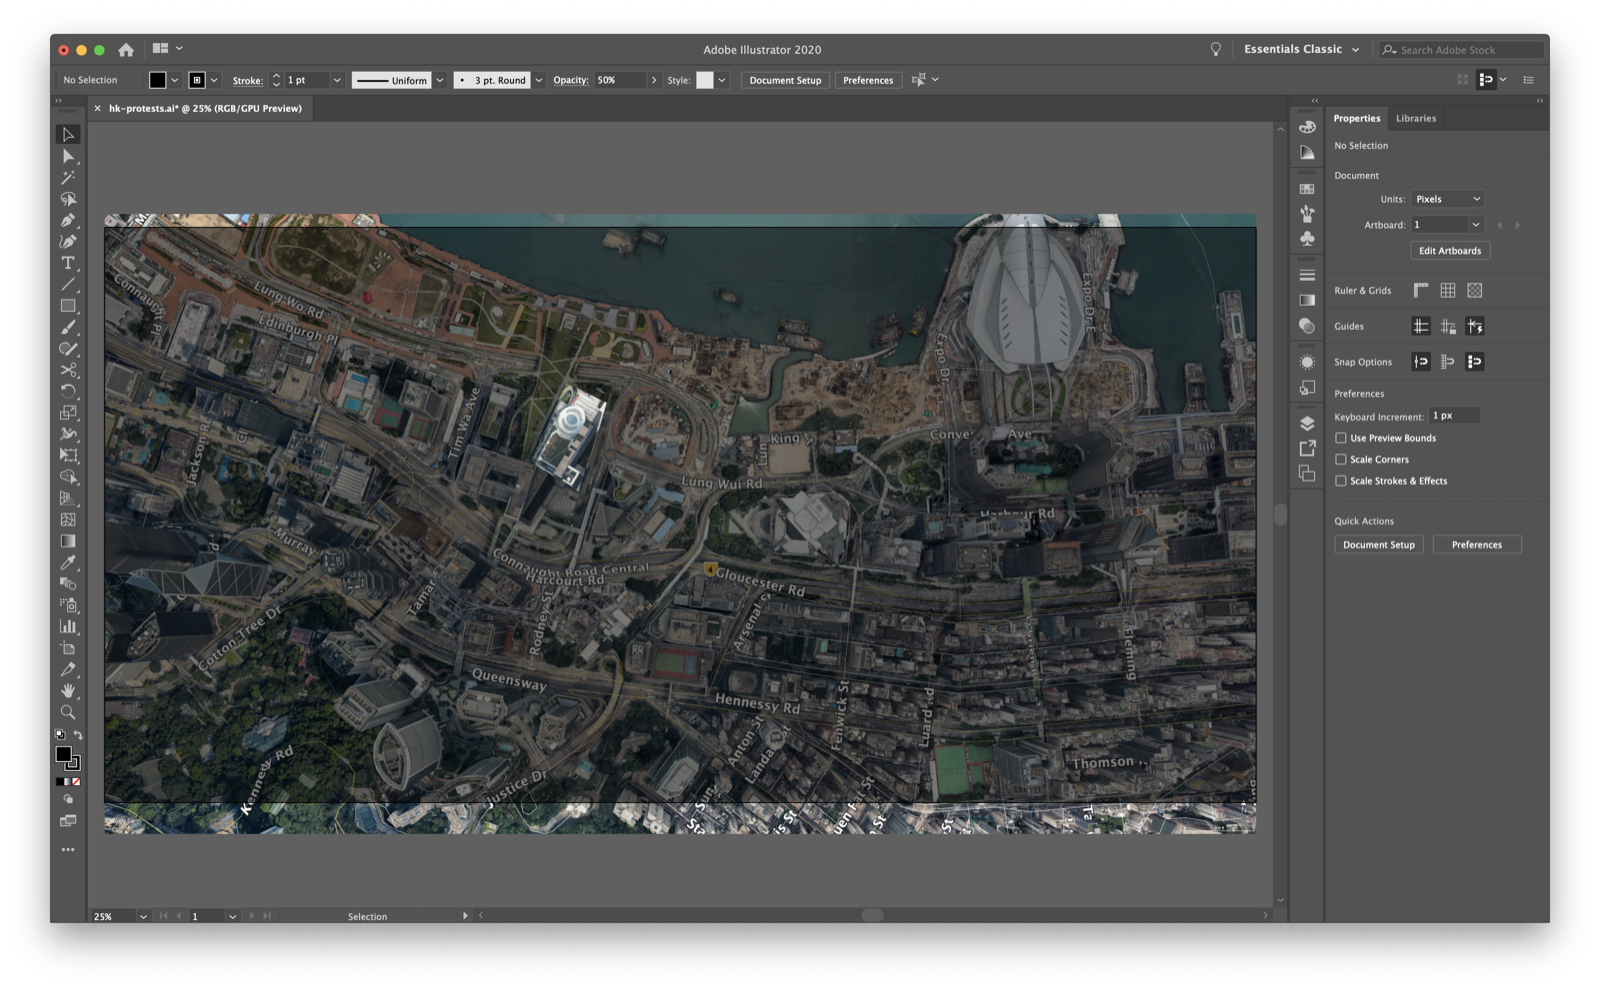
The next step is adding an overlay to darken the scene, providing highlight to the text and specified areas. To add this layer, select the Rectangle Tool from the left toolbar (or by pressing M) and highlight the entire artboard. Next, select a fill layer by clicking on the Fill box in the bottom left hand corner and set the color to black (or #000000). Finally, set the ‘Opacity’ (found in the righthand tool bar) to 50%.
With the overlay placed, we will now highlight the Legislative Council Complex by using the Compound Path tool. Start by activating the pen tool (P), as we did to trace the border in the DMZ example. This time, trace the outline of the Legislative Council Complex. Make sure you view the Complex in Google Maps so you understand the proper outline of the building. After you’ve competed the shape, click out of the Pen Tool by selecting the Selection Tool or by pressing V. Next, select both the highlighted object, as well as the overlay layer, by using the Selection Tool and holding down the Shift key.
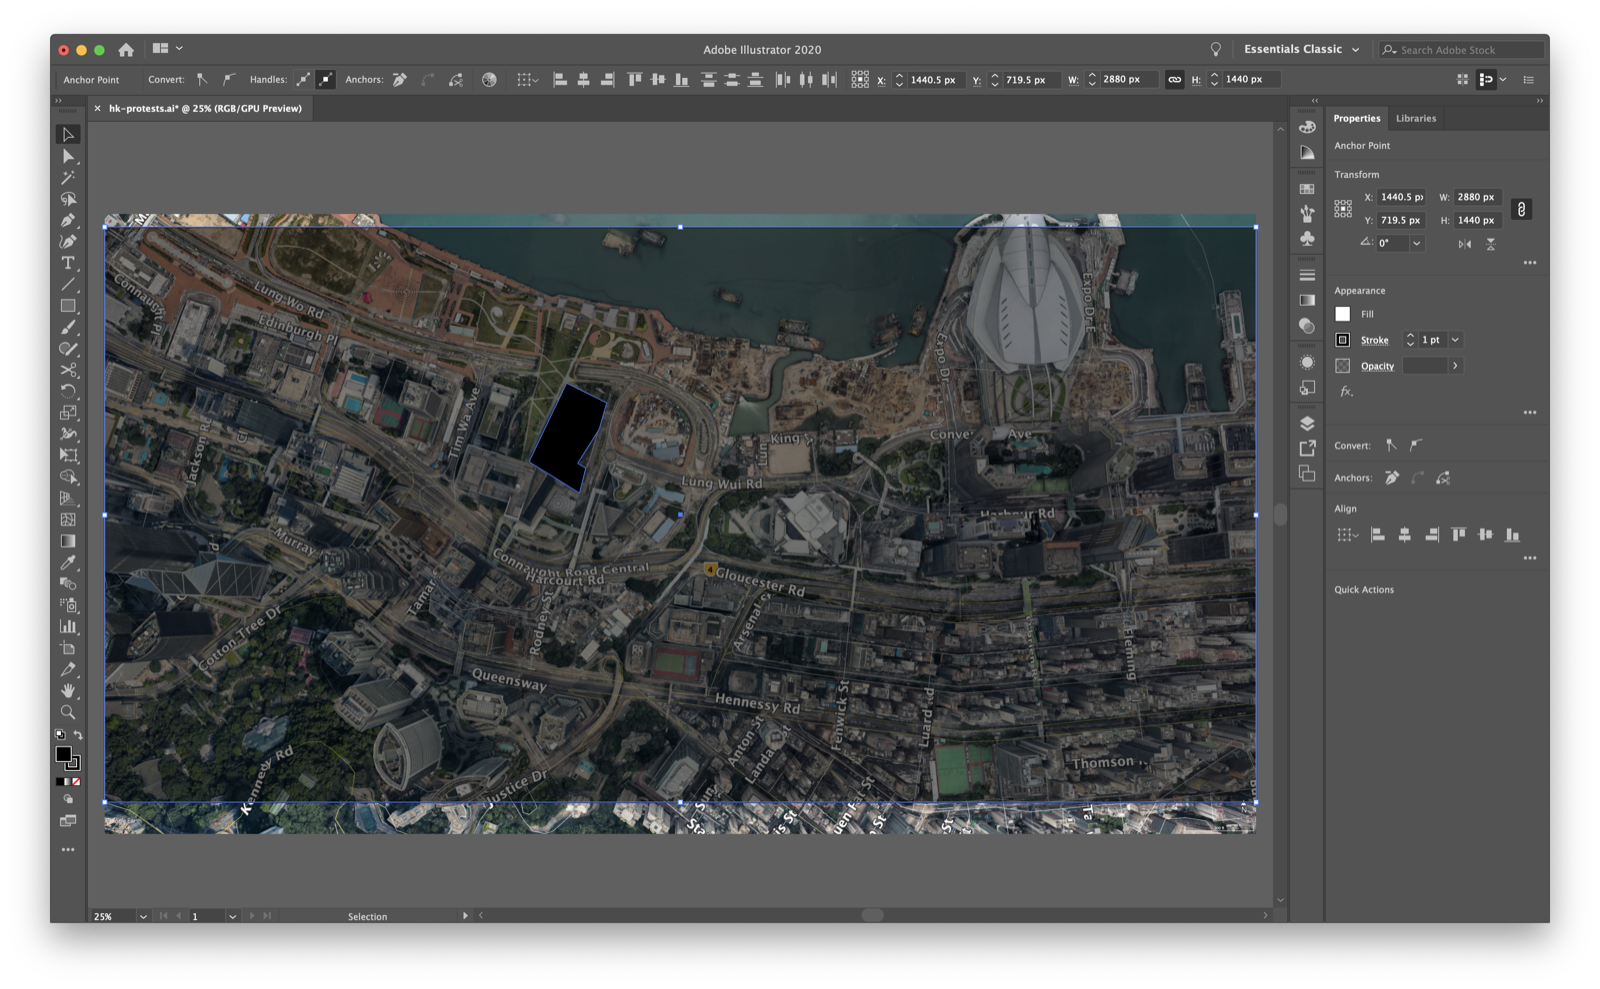
Next, in your upper toolbar, navigate to Object -> Compound Path -> Make. This will expose the Complex from the overlay layer.
Now, utilize the Text Tool, as seen in the DMZ example, to highlight the various areas shown in the New York Times example. Be sure to include both a compass as well as scale bar.
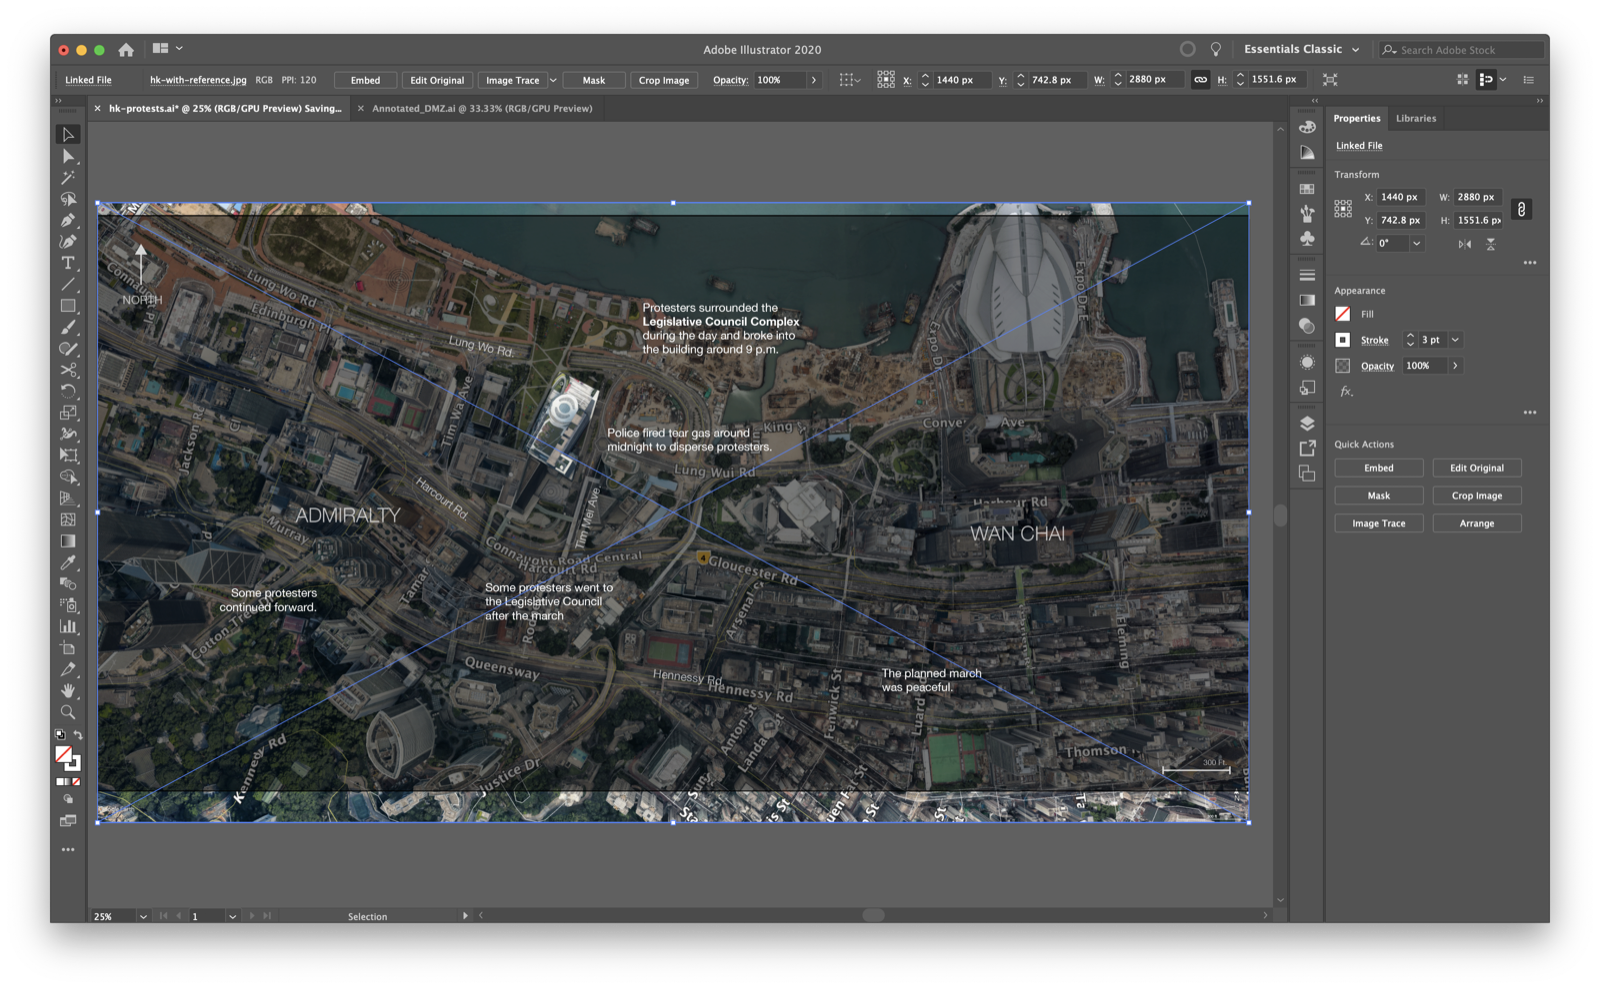
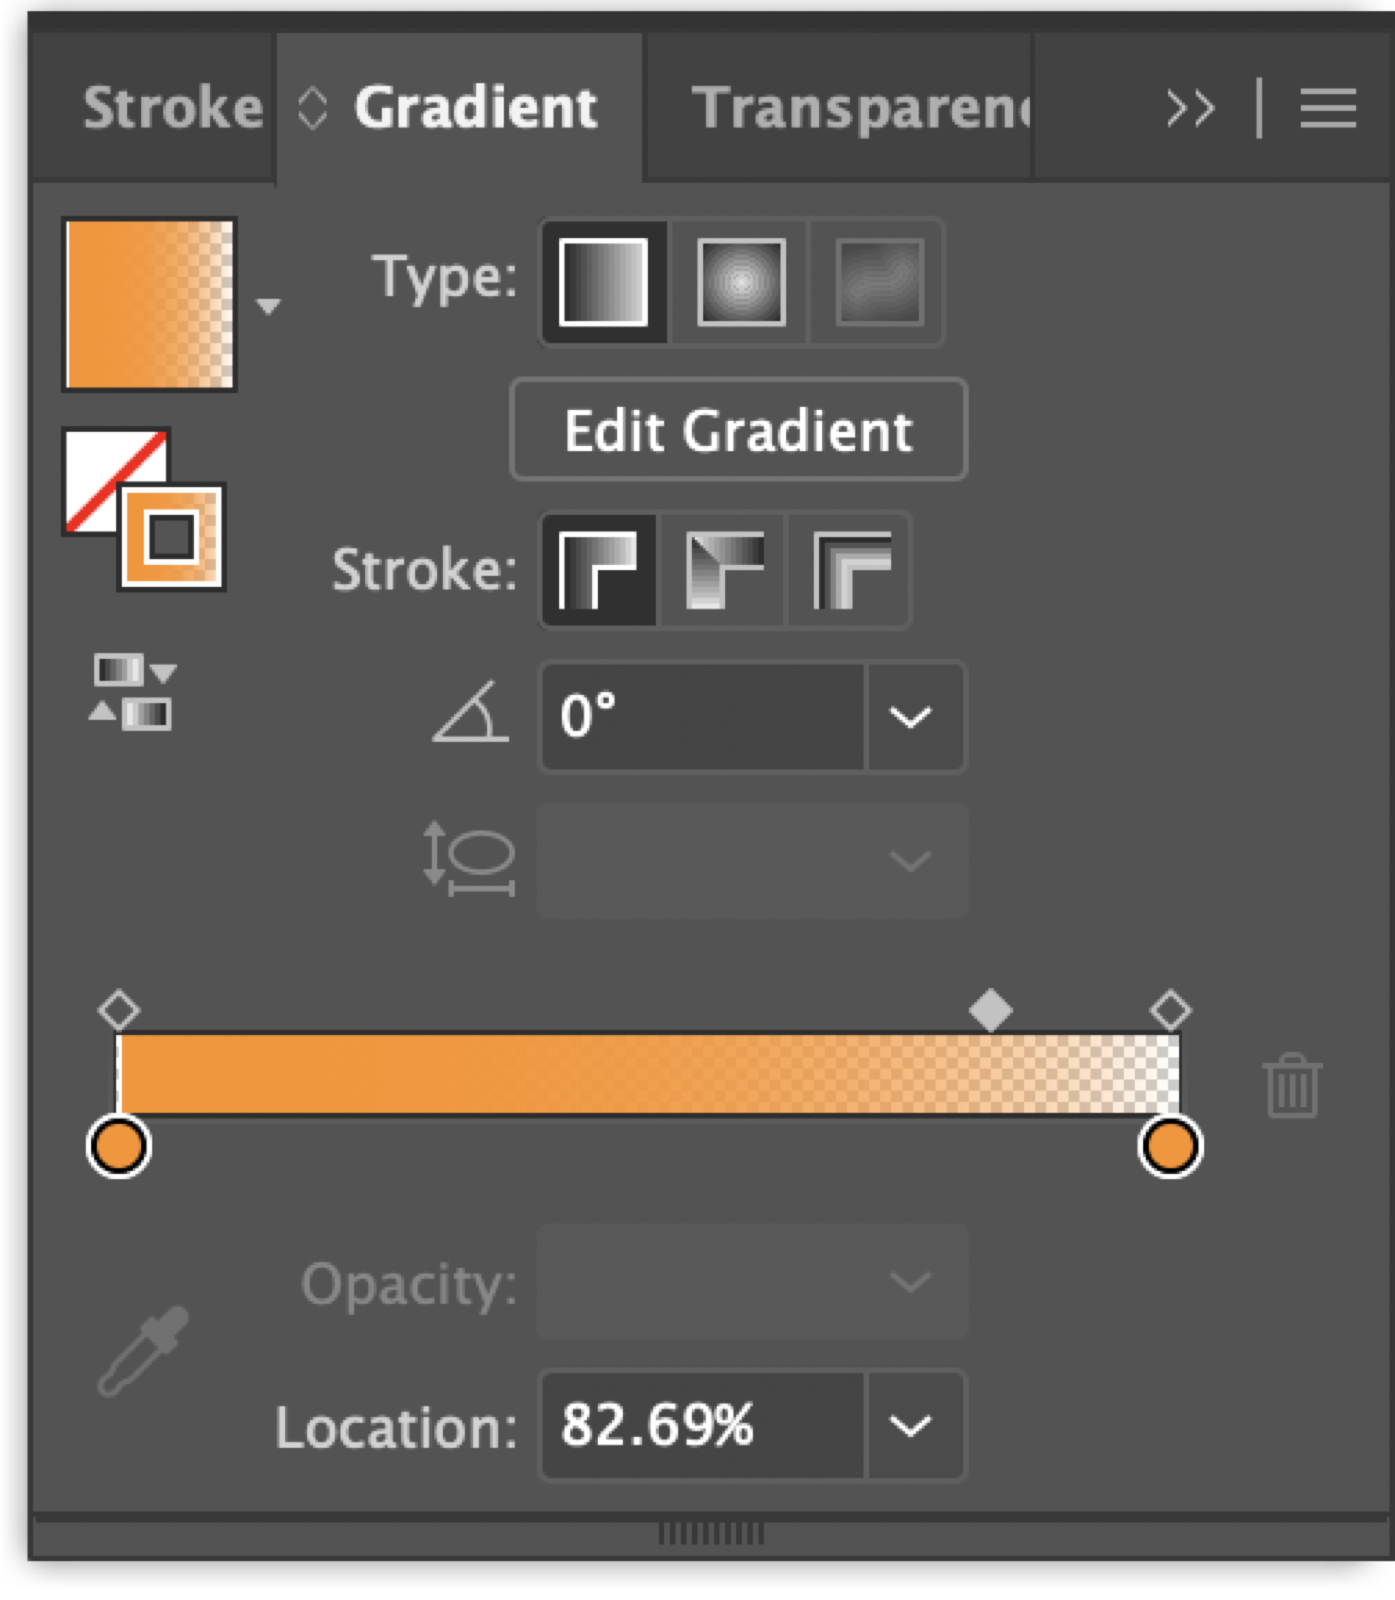
Now that we have added road labels correctly, we can click on the underlying imagery of Hong Kong and delete the top layer (with references.) We can then begin to add arrows showing movement across the streets of Hong Kong. Begin by drawing an arrow across Hennessy Rd. Do this by using the Curvature Tool, or by pressing Shift + '. Once a line is drawn, set the Stroke to 11, add an arrowhead at 40%, and add a gradient across the line. In our example, we’ve set the stroke color of the line to #ff931e.
| Single Gradient | Arrows | Double Gradient |
|---|---|---|
 |
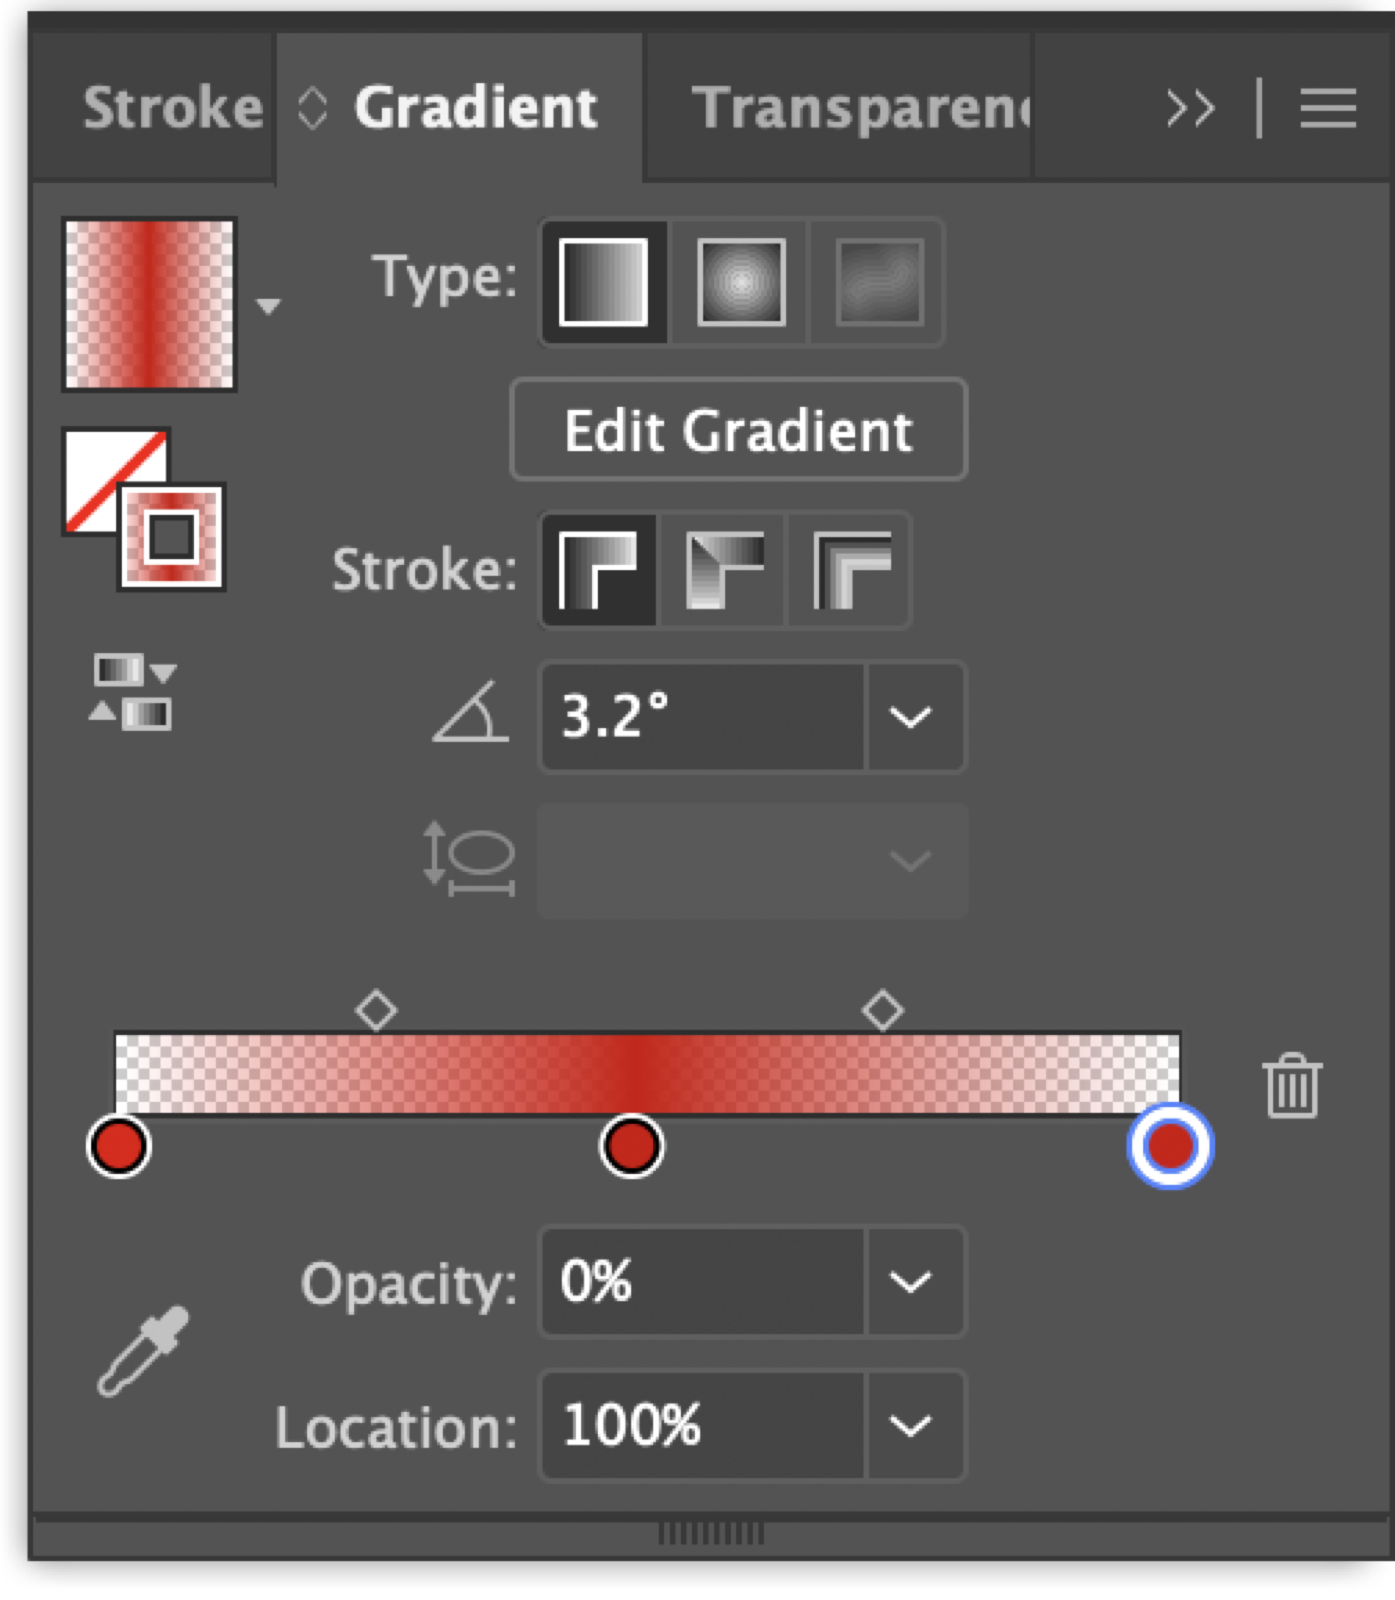 |
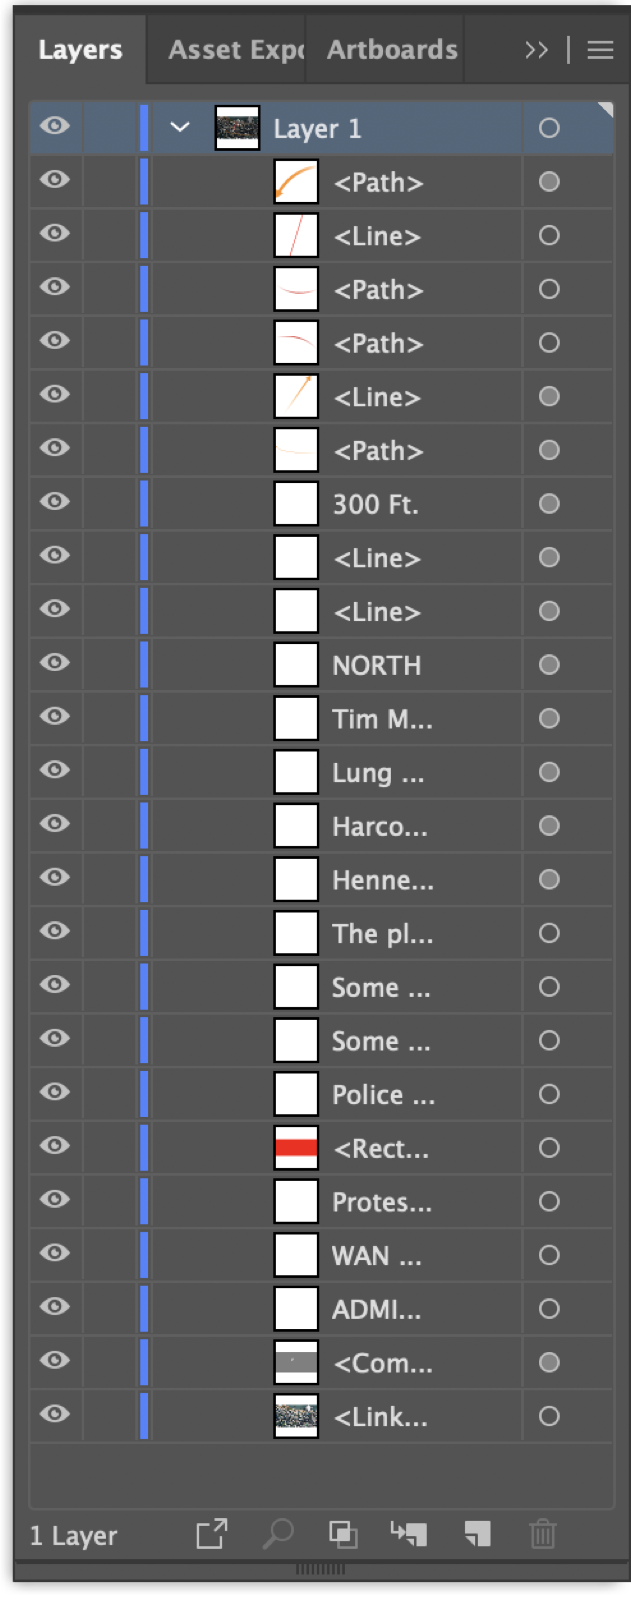
Do the same for the tear gas curves, using color #ff0000 and adding an additional gradient . Finally, use the Rectangle Tool to create a highlight for under the text “tear gas”. In looking at the arrows/text, reordered the layers so that the tear gas arrow falls under the protestor movement arrow. Also, place the rectangle under the Police text.
| Original Layers | Reordering Layers |
|---|---|
 |
 |
Now, export the file as a jpeg. The final result can be seen below.