Introduction
This tutorial will guide you through the basic steps to setup a story map using Mapbox’s storytelling template. We will use the previous web map displaying MTA turnstile data as the basis for our story. In this process we will use Mapbox GL JS, as well as Intersection Observer and Scrollama as our main JavaScript libraries.
Here are some notable examples of story maps built with Mapbox’s storytelling template:
- Saving the Nile - AlJazeera
- Nations Divided - AlJazeera
- Dutch Trade in Black People - NOS
- Nashville Tornado - Tennessean
- Finding Tovaangar - LA Times
- A Spark on Burned Mountain - SF Chronicle
Mapbox’s storytelling template relies heavily on two other JavaScript libraries: Intersection Observer and Scrollama.
-
Intersection Observer provides a way to asynchronously observe changes in the intersection of a target element with an ancestor element or with a top-level document’s viewport. In other words, this JavaScript library will help you detect the position of a specific element in relation to another element.
-
Scrollama uses Intersection Observer to provide a simple interface for creating scroll-driven interactives. You can use this library to simply trigger steps.
-
To see the full documentation on Mapbox’s storytelling template visit their Github repository.
-
Finally, here’s a link to a template that’s not discussed here but will allow your map to follow an animated path: scrolly-drive.
Initial Setup
We will start this tutorial from where we finished the last one on mapping change in subway usage during the first two weeks of the COVID-19 crisis.
You should have the following files and folders in your project folder:
├── index.html
├── map.js
├── styles.css
├── data
│   ├── medianIncome.geojson
│   └── turnstileData.geojson
└── images
    ├── Chapter_1_Image.jpg
    ├── Chapter_2_Image.jpg
    ├── Chapter_3_Image.jpg
    └── Chapter_4_Image.jpg
To follow along please download the base files.
Once you download the files, let’s quickly create a new Mapbox Style:
-
In your Mapbox Studio page create a new style based on the
Monochrome/Lighttemplate. -
Once in the editor go to the
Road networkcomponent and change theRoad networktype toSimple, and change theRoad widthto the minimum setting. -
Next, select the
Administrative boundariescomponent and hide it with the eye icon. -
Once you are done with these changes, click the
Publishbutton and copy your Style URL.
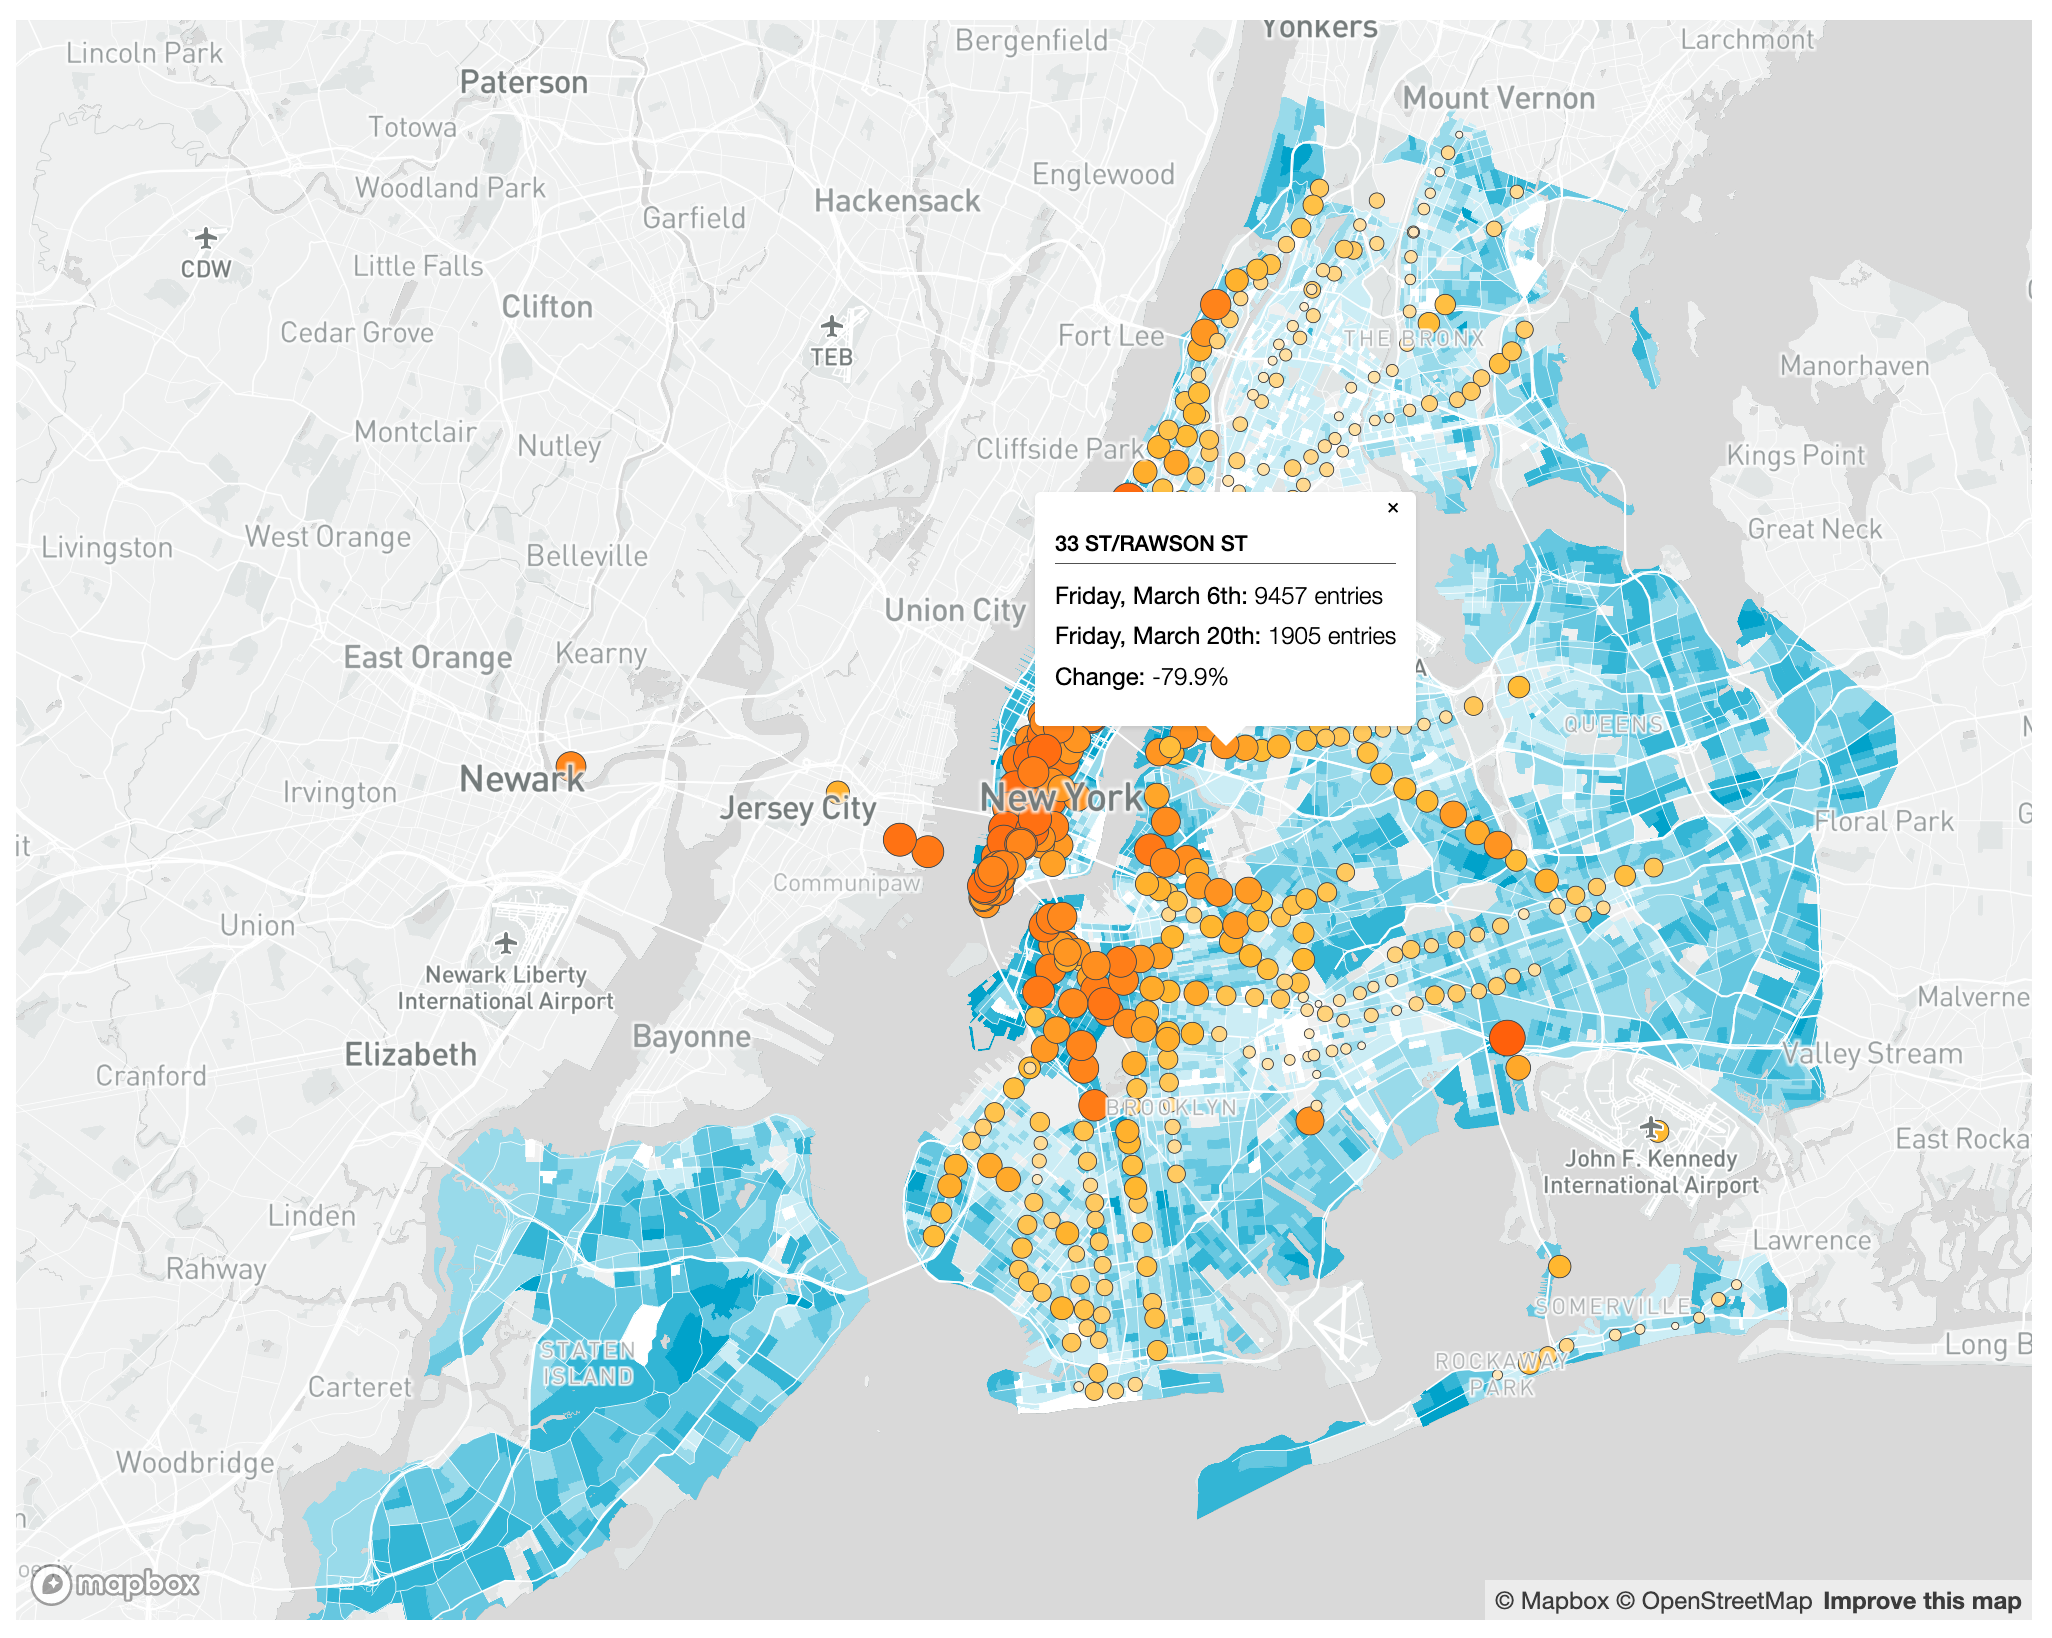
Now add your Mapbox access token and your style URL to the map.js file. Run the local host (with the Live Server extension for VS Code) and test that your map works. You should see something like this, including the ability to zoom in and out and popups when you click on individual stations.
Updating the index.html File with Libraries, Fonts and Elements
First, we will add the new JavaScript libraries to our index.html.
Right below where you link the mapbox-gl.css (in the head of our html) add the following two lines:
<script src="https://unpkg.com/[email protected]/intersection-observer.js"></script>
<script src="https://unpkg.com/scrollama"></script>
These link to the Intersection Observer and Scrollama libraries.
Next, right below these libraries add the following link to the Google Fonts API:
<link href="https://fonts.googleapis.com/css2?family=Merriweather:ital,wght@0,300;0,400;0,700;1,400&family=Roboto+Condensed:ital,wght@0,300;0,400;0,700;1,400&display=swap" rel="stylesheet">
Here we are adding the Merriweather and Roboto Condensed fonts to our site, both in light, regular and bold, as well as in regular italics. Google Fonts is an amazing resource for free fonts.
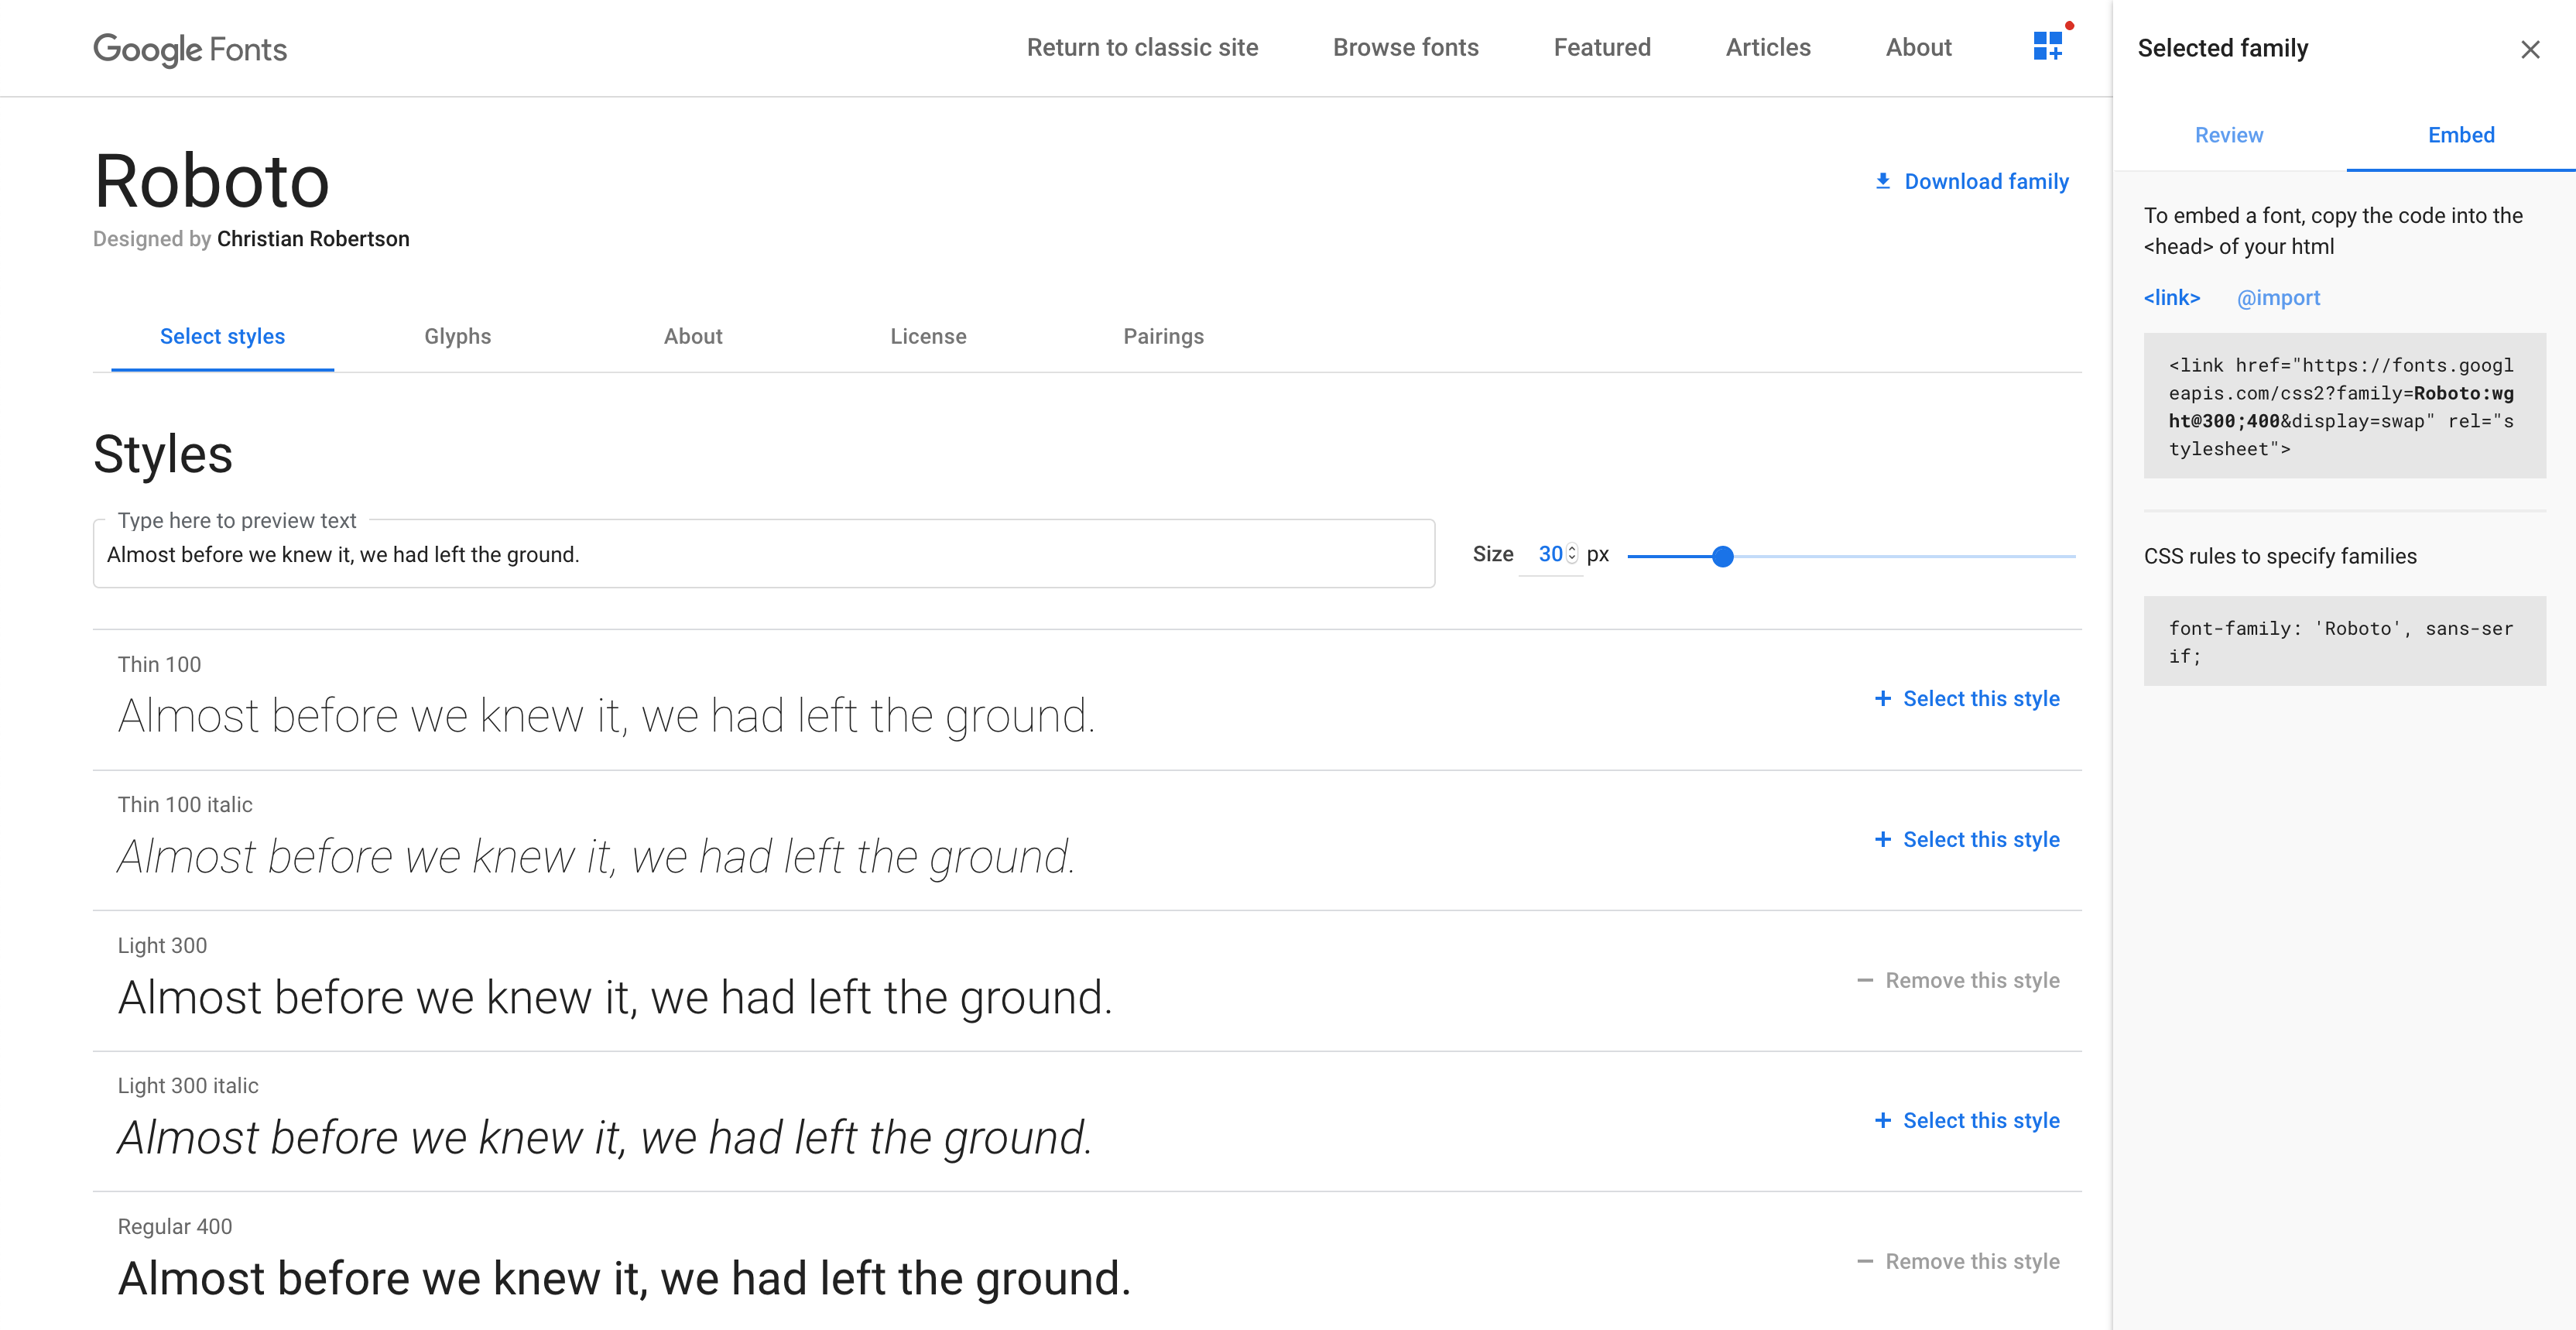
To add a font to your site, choose the font on the Google Fonts page, and click on the + Select this style button. Once you’ve selected all the fonts you want to use click on the Embed button on the right-hand panel to see the actual html code to add to your index.html file. Just be careful not to add too many fonts as it may slow down the loading of your site.
Next, let’s add one new element and one link to the body of our index.html.
Right below where we created our map div create a new div with a story id: <div id='story'></div>. This will hold everything that will go on top of the map, including the title of our story, the individual vignettes (chapters) and the footer.
And right below that, add a link to a new JavaScript file called config.js: <script src='config.js'></script>.
Your index.html file should now look like this:
<!DOCTYPE html>
<html>

<head>
    <meta charset='utf-8' />
    <title>COVID-19 Drop in Subway Usage</title>
    <meta name='viewport' content='initial-scale=1,maximum-scale=1,user-scalable=no' />
    <script src='https://api.tiles.mapbox.com/mapbox-gl-js/v2.0.0/mapbox-gl.js'></script>
    <link href='https://api.tiles.mapbox.com/mapbox-gl-js/v2.0.0/mapbox-gl.css' rel='stylesheet' />
    <script src="https://unpkg.com/[email protected]/intersection-observer.js"></script>
    <script src="https://unpkg.com/scrollama"></script>
    <link href="https://fonts.googleapis.com/css2?family=Merriweather:ital,wght@0,300;0,400;0,700;1,400&family=Roboto+Condensed:ital,wght@0,300;0,400;0,700;1,400&display=swap" rel="stylesheet">
    <link rel="stylesheet" href="styles.css">
</head>

<body>

    <div id="map"></div>
    <div id='story'></div>
    <script src='config.js'></script>
    <script src="./map.js"></script>

</body>

</html>
Adding Styling to the New html Elements
Next, we need to style the new html elements we will introduce in our story. We could do this after we add them, however, for the scrolling to work well we need to set some attributes in the styles.css file beforehand, so we might as well do all the changes to that file right now.
First, the #map element: it will have a height of 100 vh and width of 100%, which means it will be full-screen. In addition, it will be located at the top of the page (top: 0) and will have a fixed position, so it won’t move.
#map {
  top: 0;
  height: 100vh;
  width: 100%;
  position: fixed;
}
Next, the #header element, which will hold the title, byline and an introductory description of the project. It will have a minimum height of 100 vh and auto so it will also be full-screen. However, it will have the default z-index of 5 which means it will stand on top of the map.
#header {
  margin: auto;
  min-height: 100vh;
  width: 100%;
  position: relative;
  z-index: 5;
  padding: 2vh 0vh 5vh 0vh;
}
Next, the #features element, which will hold all the vignettes (or chapters). We’ll add some padding here to give it some space in relation to the #header.
In addition, we will add another #features entry but only for media with a maximum width of 750px. This one will have a width of 90vw.
#features {
  padding-top: 80vh;
  padding-bottom: 10vh;
}
@media (max-width: 750px) {
  #features {
    width: 90vw;
    margin: 0 auto;
  }
}
Finally, the footer, which will hold links to the data sources as well as copyright information. It will have a width of 100% which means it will stretch horizontally across the whole page. It will also have a z-index of 5 so that it stands on top of the map.
#footer {
  min-height: 2vh;
  text-align: left;
  line-height: 25px;
  width: 100%;
  position: relative;
  z-index: 5;
}
Now let’s set the more specific attributes of the elements inside each one of these sections. In all of these we are setting the font-family, font-size, font-weight, margin, text-align, and max-width. In the h1 element for the #header we are also transforming the text to uppercase:
#header h1 {
    font-weight: 700;
    text-transform: uppercase;
    font-family: 'Merriweather', serif;
    text-align: left;
    margin: auto;
    max-width: 600px;
}
#header h4 {
    font-family: 'Roboto Condensed', sans-serif;
    font-weight: 300;
    margin-bottom: 0.5em;
    margin-left: auto;
    margin-right: auto;
    text-align: left;
    max-width: 600px;
}
#header p.byline {
    font-weight: 300;
    font-size: 0.9em;
    margin: 0.5em auto 0.8em auto;
}
#header p {
    font-family: 'Roboto Condensed', sans-serif;
    font-weight: 400;
    text-align: left;
    font-size: 1.2em;
    max-width: 600px;
    margin: 1em auto 1em auto;
}
#features h3 {
    font-weight: 700;
    text-transform: uppercase;
    font-family: 'Merriweather', serif;
    text-align: left;
    max-width: 50vw;
}
#features p {
    font-family: 'Roboto Condensed', sans-serif;
    text-align: left;
    font-size: 1.2em;
    max-width: 50vw;
}
#features .imageCredit {
  font-size: 0.9em;
  margin-top: -5px;
}
#footer p {
  font-family: 'Roboto Condensed', sans-serif;
  font-size: 0.9em;
  max-width: 600px;
  padding: 0.75em 0em;
  margin: 0px auto;
}
We will also style links like this:
a, a:hover, a:visited {
  color: #e96138;
}
And the last thing that we need to set is a series of styling attributes for some of the classes we might use. These all come from the Mapbox storytelling template and have been modified very slightly or not at all:
.hidden {
  visibility: hidden;
}
.centered {
  width: 50vw;
  margin: 0 auto;
}
.lefty {
  width: 33vw;
  margin-left: 5vw;
}
.righty {
  width: 33vw;
  margin-left: 62vw;
}
.fully {
  width: 100%;
  margin: auto;
}
.light {
  color: #444;
  background-color: #ffffff;
}
.dark {
  color: #fafafa;
  background-color: #444;
}
.step {
  padding-bottom: 50vh;
  opacity: 0.15;
}
.step.active {
  opacity: 0.99;
}
.step div {
  padding: 25px 50px;
  line-height: 25px;
  font-size: 13px;
}
.step img {
  width: 100%;
}
@media (max-width: 750px) {
  .centered, .lefty, .righty, .fully {
    width: 90vw;
    margin: 0 auto;
  }
}
/* Fix issue on mobile browser where scroll breaks  */
.mapboxgl-canvas-container.mapboxgl-touch-zoom-rotate.mapboxgl-touch-drag-pan,
.mapboxgl-canvas-container.mapboxgl-touch-zoom-rotate.mapboxgl-touch-drag-pan .mapboxgl-canvas {
  touch-action: unset;
}
If you reload your map you shouldn’t see that many changes, mostly because we haven’t coded most of the elements we’ve styling in the css. The only major thing you will see is that your map is now full screen.
Your new styles.css file should look like this:
body {
    margin: 0;
    padding: 0;
}
#map {
  top: 0;
  height: 100vh;
  width: 100%;
  position: fixed;
}
#header {
  margin: auto;
  min-height: 100vh;
  width: 100%;
  position: relative;
  z-index: 5;
  padding: 2vh 0vh 5vh 0vh;
}
#features {
  padding-top: 80vh;
  padding-bottom: 10vh;
}
@media (max-width: 750px) {
  #features {
    width: 90vw;
    margin: 0 auto;
  }
}
#footer {
  min-height: 2vh;
  text-align: left;
  line-height: 25px;
  width: 100%;
  position: relative;
  z-index: 5;
}
#header h1 {
    font-weight: 700;
    text-transform: uppercase;
    font-family: 'Merriweather', serif;
    text-align: left;
    margin: auto;
    max-width: 600px;
}
#header h4 {
    font-family: 'Roboto Condensed', sans-serif;
    font-weight: 300;
    margin-bottom: 0.5em;
    margin-left: auto;
    margin-right: auto;
    text-align: left;
    max-width: 600px;
}
#header p.byline {
    font-weight: 300;
    font-size: 0.9em;
    margin: 0.5em auto 0.8em auto;
}
#header p {
    font-family: 'Roboto Condensed', sans-serif;
    font-weight: 400;
    text-align: left;
    font-size: 1.2em;
    max-width: 600px;
    margin: 1em auto 1em auto;
}
#features h3 {
    font-weight: 700;
    text-transform: uppercase;
    font-family: 'Merriweather', serif;
    text-align: left;
    max-width: 50vw;
}
#features p {
    font-family: 'Roboto Condensed', sans-serif;
    text-align: left;
    font-size: 1.2em;
    max-width: 50vw;
}
#features .imageCredit {
  font-size: 0.9em;
  margin-top: -5px;
}
#footer p {
  font-family: 'Roboto Condensed', sans-serif;
  font-size: 0.9em;
  max-width: 600px;
  padding: 0.75em 0em;
  margin: 0px auto;
}
a, a:hover, a:visited {
  color: #e96138;
}
.hidden {
  visibility: hidden;
}
.centered {
  width: 50vw;
  margin: 0 auto;
}
.lefty {
  width: 33vw;
  margin-left: 5vw;
}
.righty {
  width: 33vw;
  margin-left: 62vw;
}
.fully {
  width: 100%;
  margin: auto;
}
.light {
  color: #444;
  background-color: #ffffff;
}
.dark {
  color: #fafafa;
  background-color: #444;
}
.step {
  padding-bottom: 50vh;
  opacity: 0.15;
}
.step.active {
  opacity: 0.99;
}
.step div {
  padding: 25px 50px;
  line-height: 25px;
  font-size: 13px;
}
.step img {
  width: 100%;
}
@media (max-width: 750px) {
  .centered, .lefty, .righty, .fully {
    width: 90vw;
    margin: 0 auto;
  }
}
/* Fix issue on mobile browser where scroll breaks  */
.mapboxgl-canvas-container.mapboxgl-touch-zoom-rotate.mapboxgl-touch-drag-pan,
.mapboxgl-canvas-container.mapboxgl-touch-zoom-rotate.mapboxgl-touch-drag-pan .mapboxgl-canvas {
  touch-action: unset;
}
Creating the config.js File
The config.js file will hold all of your map’s information, as well as all the information that will power the transitions in your storymap and the vignettes’ content. This file doesn’t really have any JavaScript functions, it is just a series of variables, holding html code, and one single large variable in the form of a dictionary. It’s overall structure is as follows:
├── topTitleDiv: the subtitle above the main article title
├── titleDiv: the main article title
├── bylineDiv: the byline
├── descriptionDiv: main introductory text below article
├── footerDiv: data sources, credits, copyright, etc
├── divChapter1 (2, 3, 4...): title, media, credits, text for each chapter
├── config
    ├── mapbox style url
    ├── mapbox access token
    ├── show markers (true or false)
    ├── marker color
    ├── vignette color theme (light or dark)
    ├── use 3d terrain layer (true or false)
    ├── topTitle: reference to topTitleDiv (above)
    ├── title: reference to titleDiv (above)
    ├── subtitle
    ├── byline: reference to bylineDiv (above)
    ├── description: reference to descriptionDiv (above)
    ├── footer: reference to footerDiv (above)
    └── chapters: as many as needed
        ├── id: this will allow you to style them individually
        ├── alignment: horizontal vignette alignment (centered, lefty, righty, or fully)
        ├── hidden (true or false)
        ├── chapterDiv: reference to the divChapter1 (2, 3, 4...) (above)
        ├── location
        │   ├── center
        │   ├── zoom
        │   ├── zoomSmall: zoom when viewing on small screens
        │   ├── pitch
        │   └── bearing
        ├── mapAnimation: type of transition (flyto, easTo, or jumpTo)
        ├── rotateAnimation (true or false)
        ├── callback: use this to run custom javascript function
        ├── onChapterEnter: what layers should be turned on or off when the chapter starts
        │   ├── layer: layer id
        │   ├── opacity
        │   └── duration: the length of the opacity transition
        └── onChapterExit: what layers should be turned on or off when the chapter ends
            ├── layer: layer id
            ├── opacity
            └── duration: the length of the opacity transition
The main thing to note here is that some of those values are just text, others are numbers (such as the zoom, pitch, bearing), and others are html elements written as text. These last ones are all the top variables outside the main config variable. This can all be modified on the map.js file but initially we thought those elements would include links and thus needed to be html as opposed to plain text.
Also make sure that you don’t introduce any line breaks inside values as this will break the syntax of the JSON variable.
Here’s my pre-populated config.js file. Make sure you fill in your Mapbox access token and style URL at the top:
let topTitleDiv = "<h4>Points Unknown | Tutorial 10 | Mapbox Storytelling</h4>";
let titleDiv =
"<h1>The Geographical Distribution of Subway Usage Decrease Due to COVID-19</h1>";
let bylineDiv = "<p>By Juan Francisco Saldarriaga and Michael Krisch</p>";
let descriptionDiv =
'<p>This tutorial demonstrates how to use <a href="https://github.com/mapbox/storytelling">Mapbox Storytelling</a> with our previous web mapping example. Here we will use Mapbox storytelling template to first, give an overview of the decrease in subway usage around the city, and second, zoom into three different locations that exemplify the diversity of conditions around New York.</p>' +
'<p>We will use the <a href="https://pointsunknown.nyc/web%20mapping/mapbox/2020/03/25/10_WebmappingTurnstileData.html">previous web map displaying MTA turnstile data</a> as the basis for our story. In this process we will use Mapbox GL JS, as well as Intersection Observer and Scrollama as our main JavaScript libraries.</p>' +
"<p>Lorem ipsum dolor, sit amet consectetur adipisicing elit. In harum natus eos cum rem iure aperiam omnis distinctio illo quis, sunt nesciunt sint impedit deleniti dolor saepe necessitatibus eligendi aut?</p><p>Lorem ipsum dolor, sit amet consectetur adipisicing elit. In harum natus eos cum rem iure aperiam omnis distinctio illo quis, sunt nesciunt sint impedit deleniti dolor saepe necessitatibus eligendi aut?</p>" +
'<p style="text-align:center">Scroll to continue<br>▼</p>';
let footerDiv =
'<p>This story is based on data by the <a href="http://web.mta.info/developers/turnstile.html">Metropolitan Transit Authority</a> and reporting by the <a href="https://www.nytimes.com/2020/04/09/nyregion/coronavirus-queens-corona-jackson-heights-elmhurst.html">New York Times</a>, <a href="https://ny.curbed.com/2020/3/24/21192454/coronavirus-nyc-transportation-subway-citi-bike-covid-19">Curbed</a>, and <a href="https://thecity.nyc/2020/03/subway-ridership-plunge-deepest-at-big-manhattan-stations.html">The City</a>.</p>' +
'<p><a href="https://www.mapbox.com/about/maps/" target="_blank">© Mapbox</a> | <a href="http://www.openstreetmap.org/about/" target="_blank">© OpenStreetMap</a> | <a href="https://brown.columbia.edu">The Brown Institute for Media Innovation</a></p>';
let divChapter1 =
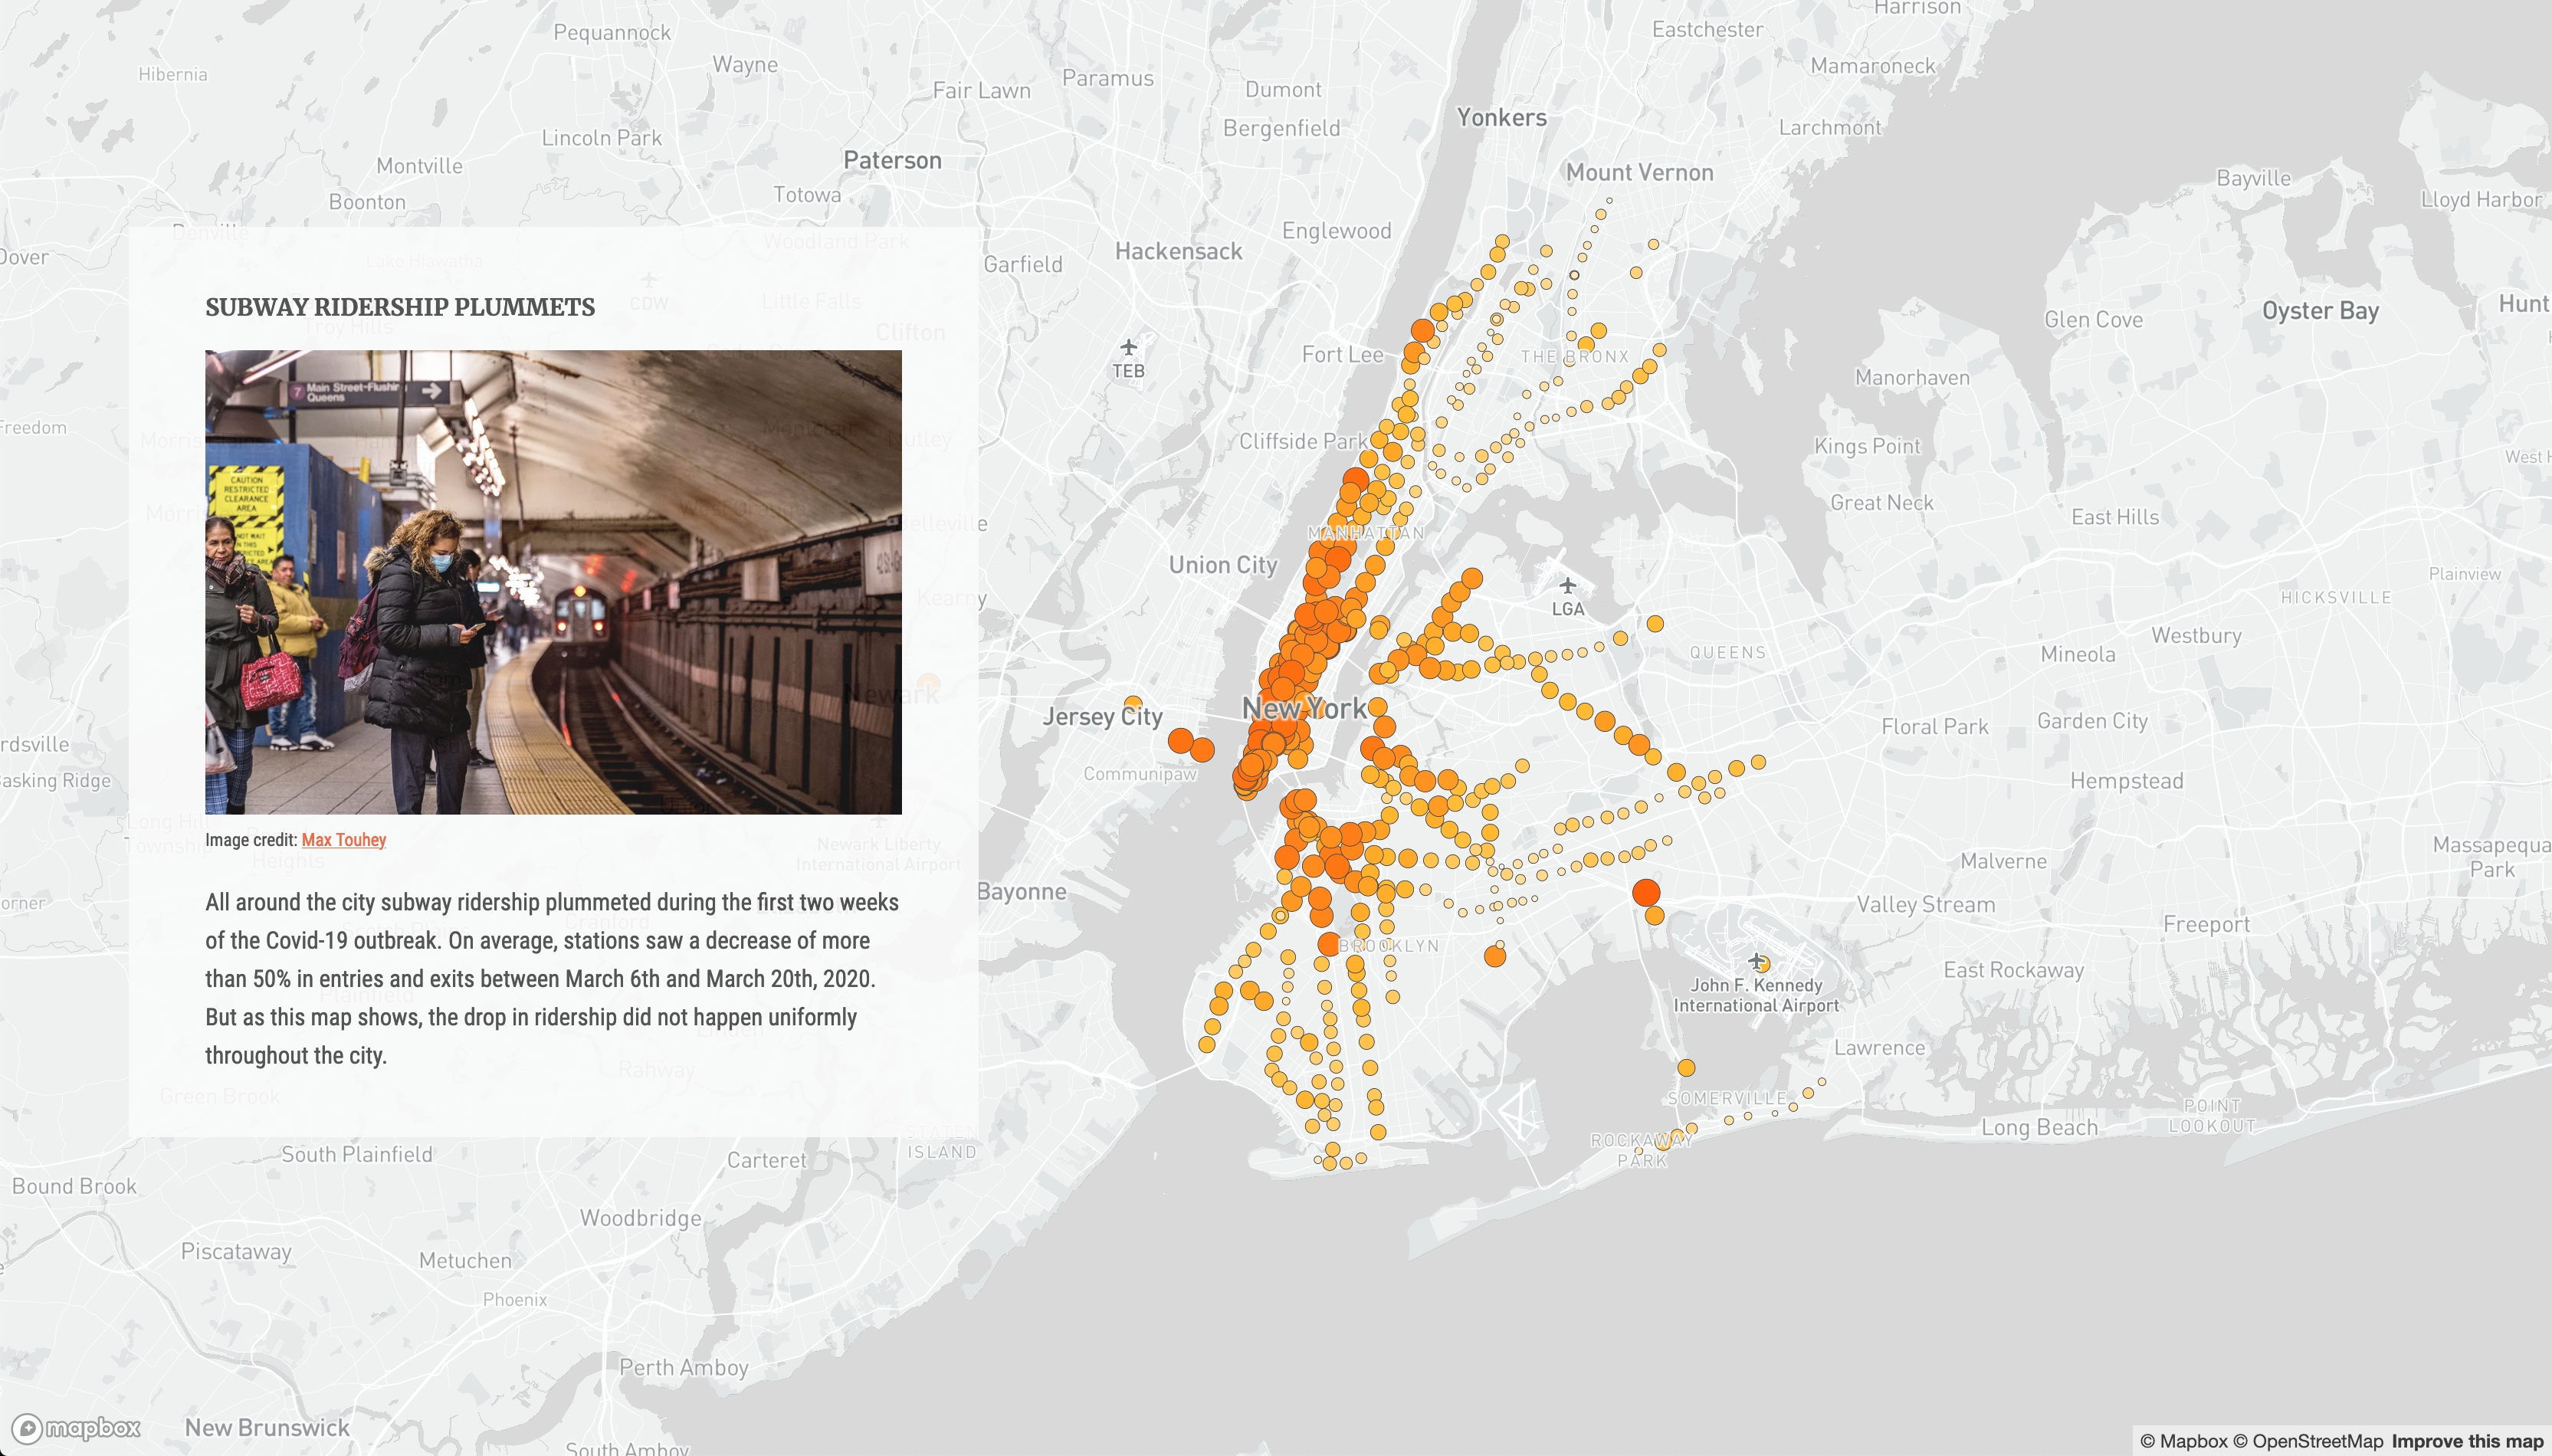
"<h3>Subway Ridership Plummets</h3>" +
'<img src="images/Chapter_1_Image.jpg">' +
'<p class="imageCredit"><a href="http://www.metouhey.com/">Max Touhey</a></p>' +
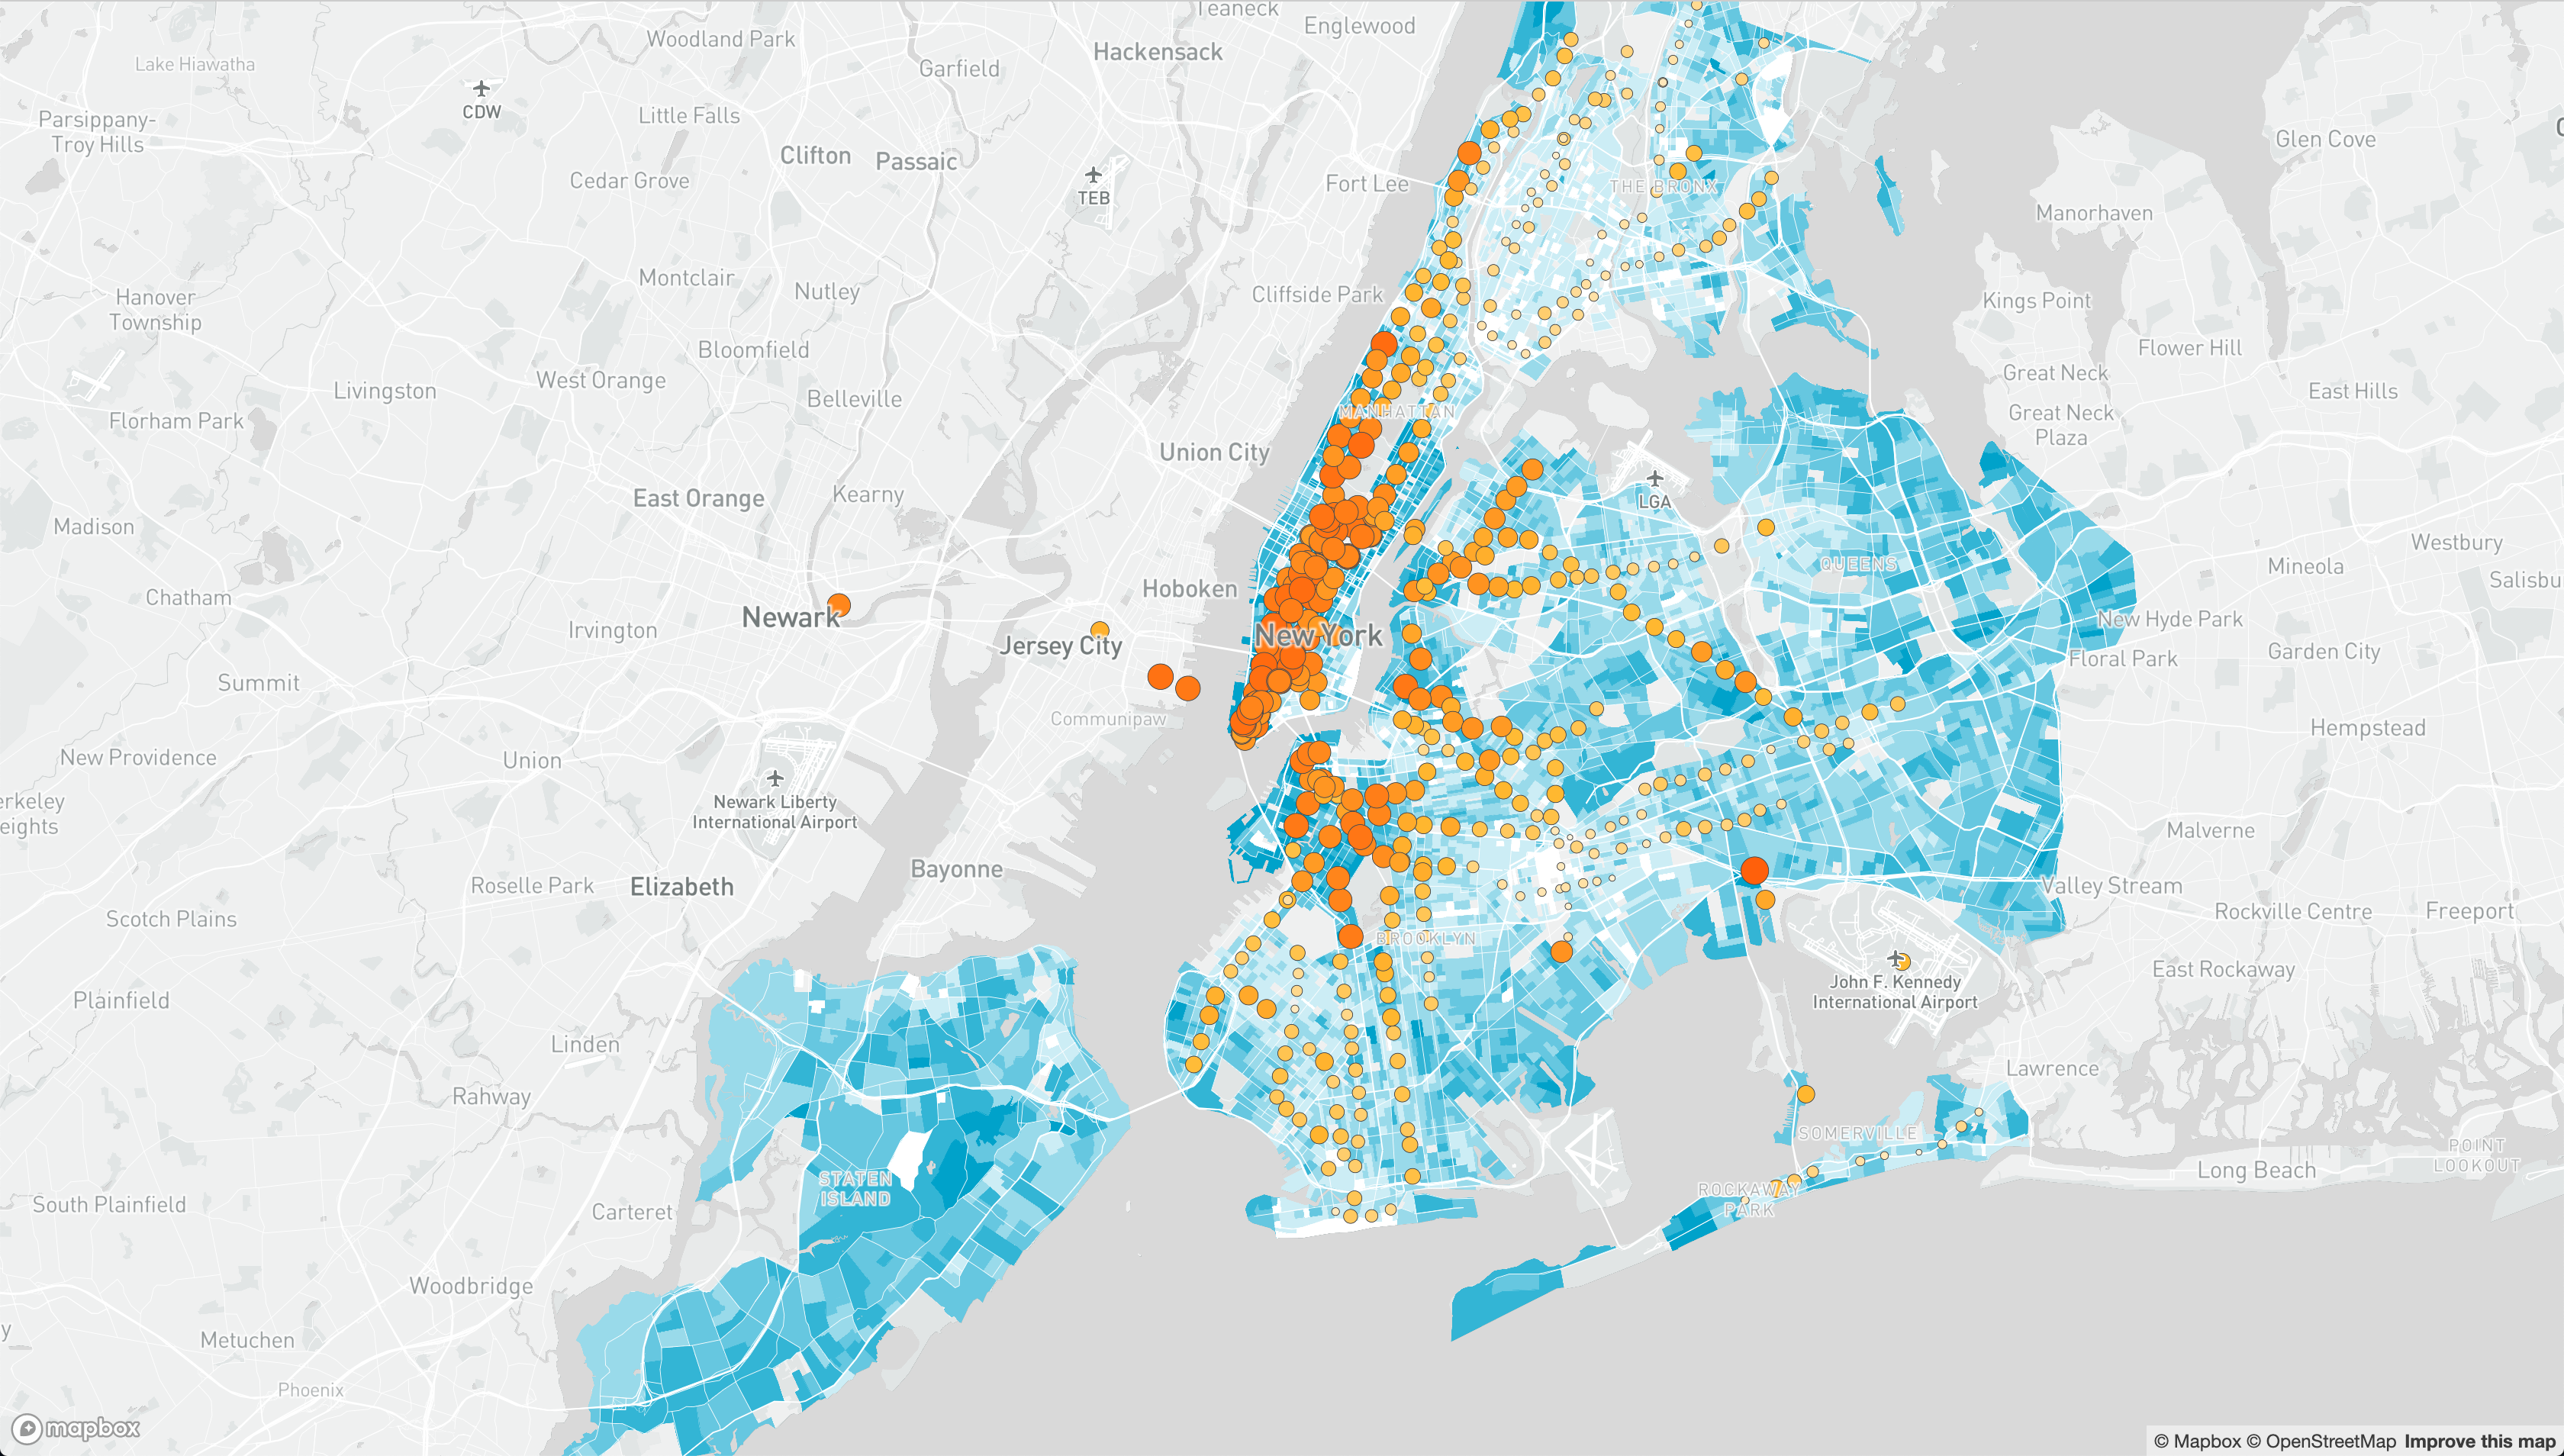
"<p>All around the city subway ridership plummeted during the first two weeks of the Covid-19 outbreak. On average, stations saw a decrease of more than 50% in entries and exits between March 6th and March 20th, 2020. But as this map shows, the drop in ridership did not happen uniformly throughout the city.</p>";
let divChapter2 =
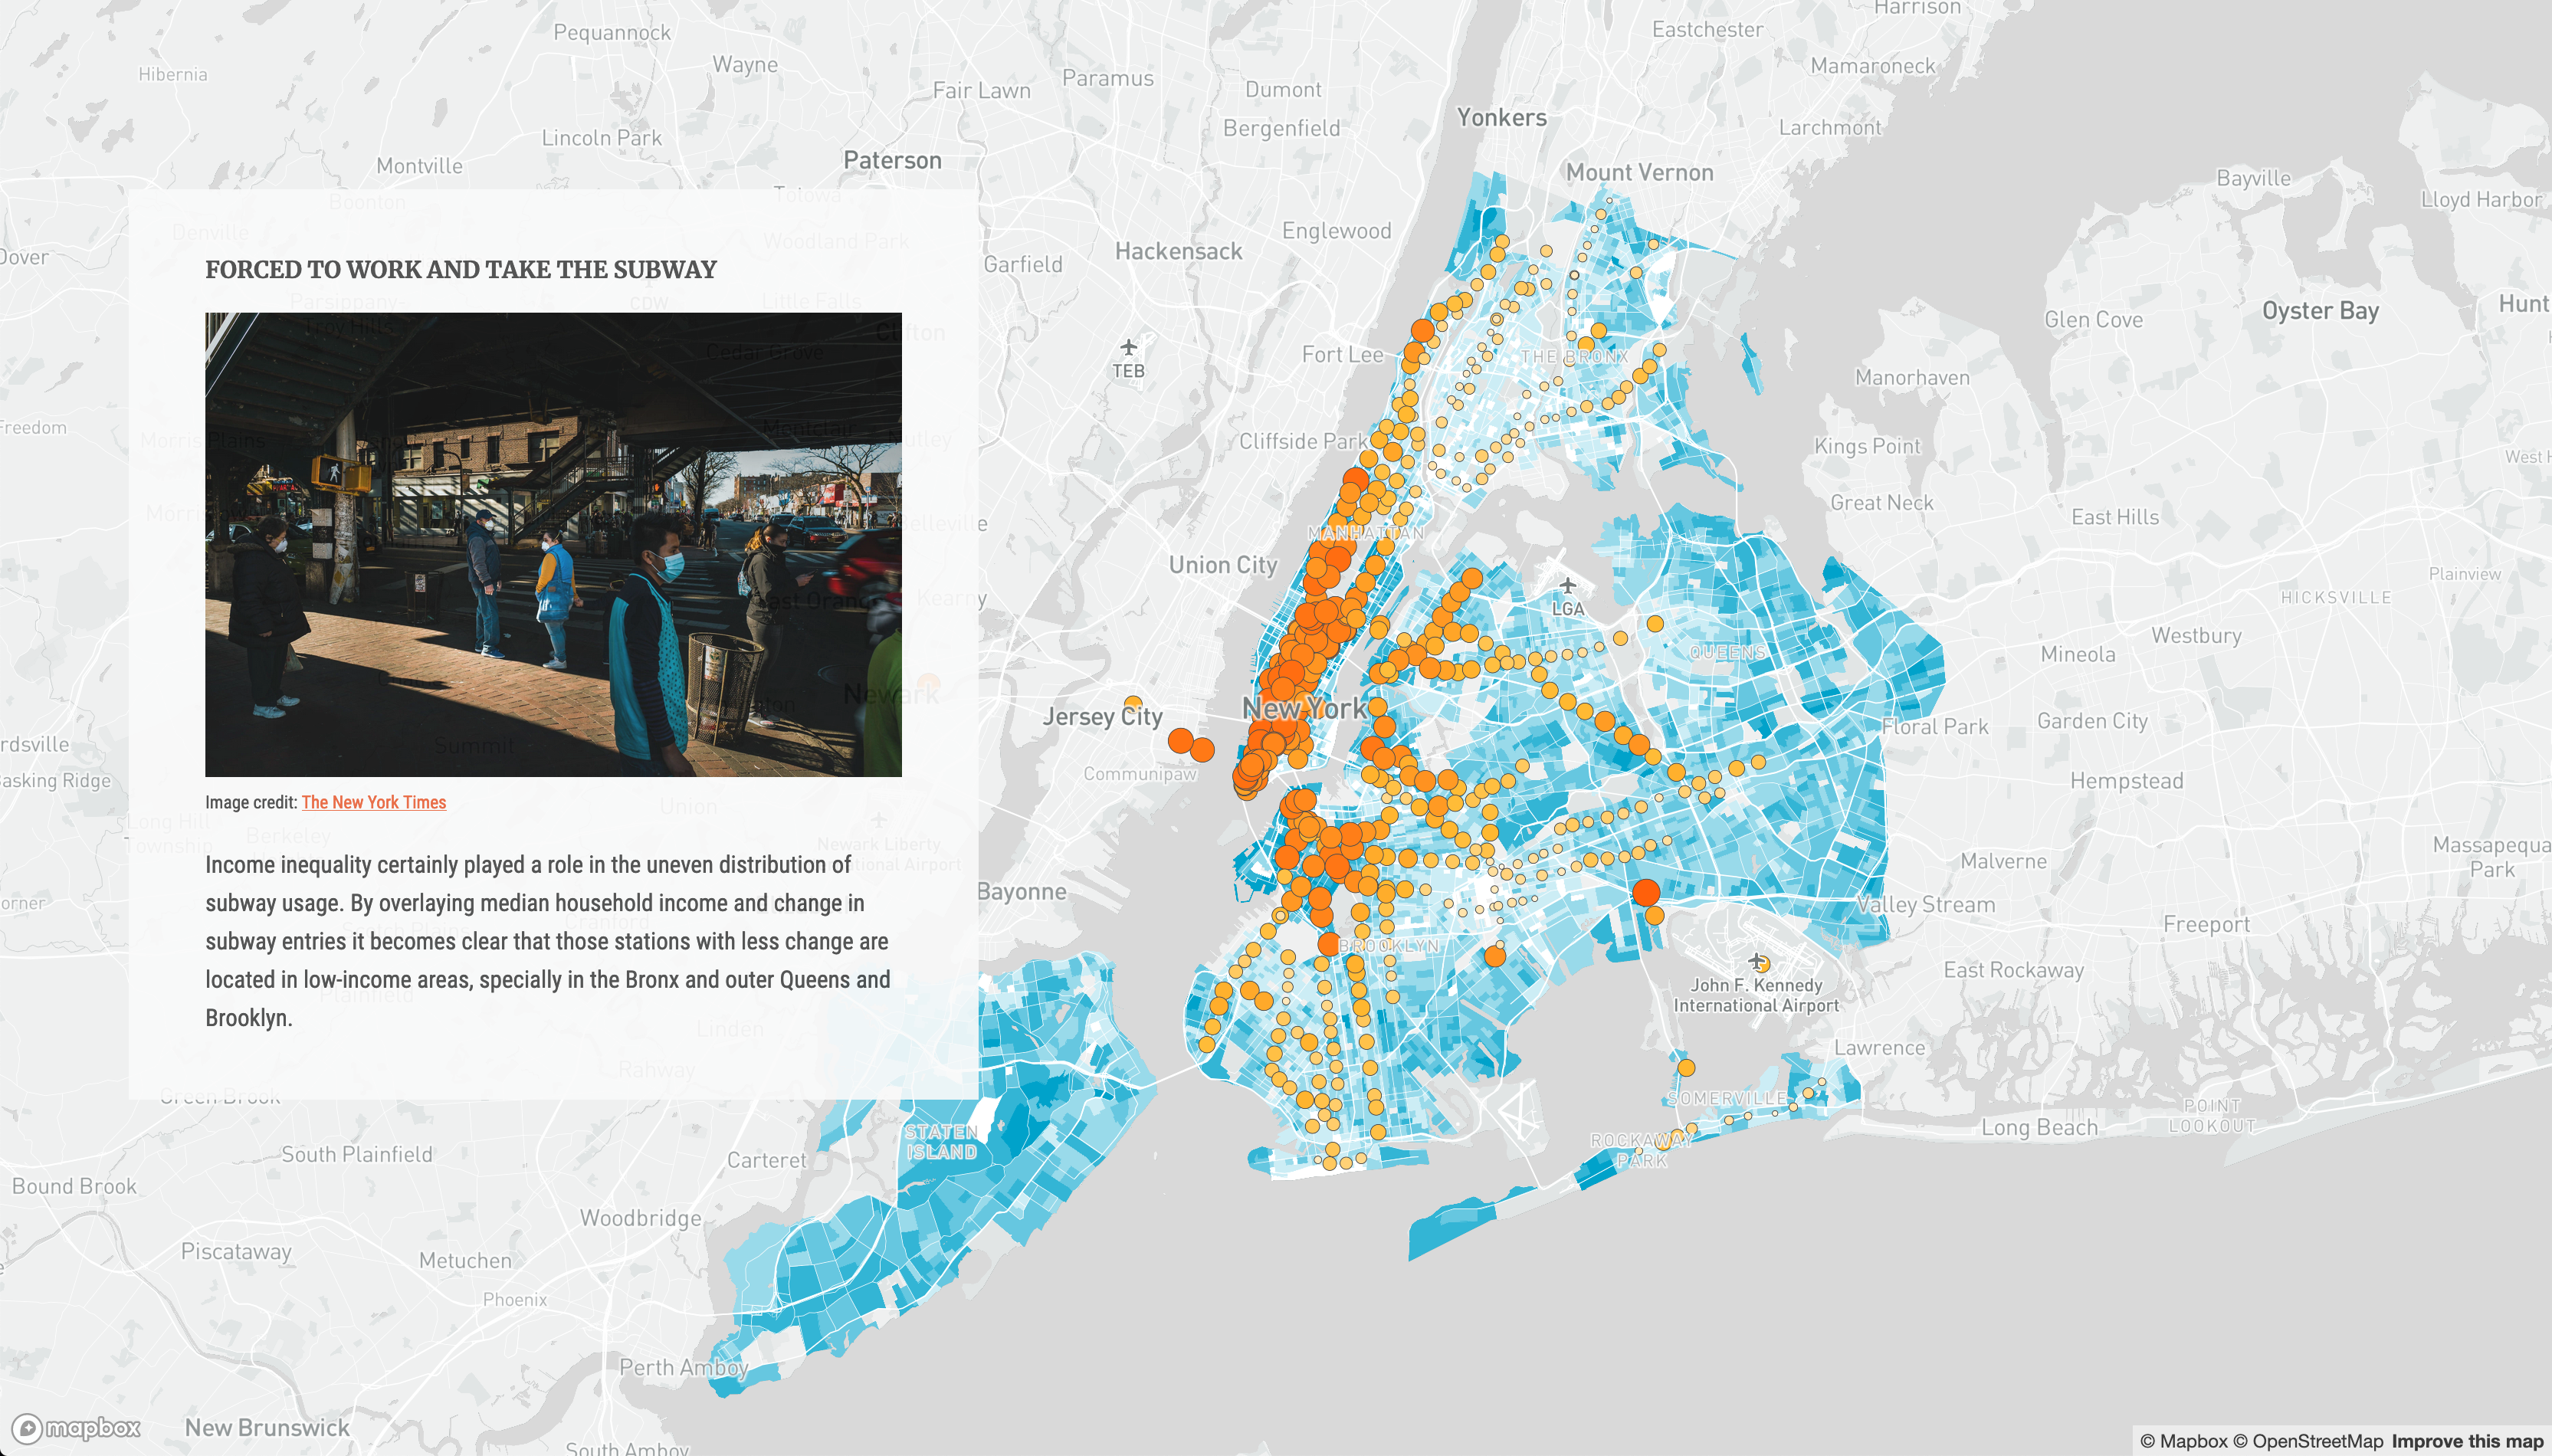
"<h3>Forced to work and take the subway</h3>" +
'<img src="images/Chapter_2_Image.jpg">' +
'<p class="imageCredit"><a href="https://www.nytimes.com/2020/04/09/nyregion/coronavirus-queens-corona-jackson-heights-elmhurst.html">The New York Times</a></p>' +
"<p>Income inequality certainly played a role in the uneven distribution of subway usage. By overlaying median household income and change in subway entries it becomes clear that those stations with less change are located in low-income areas, specially in the Bronx and outer Queens and Brooklyn.</p>";
let divChapter3 =
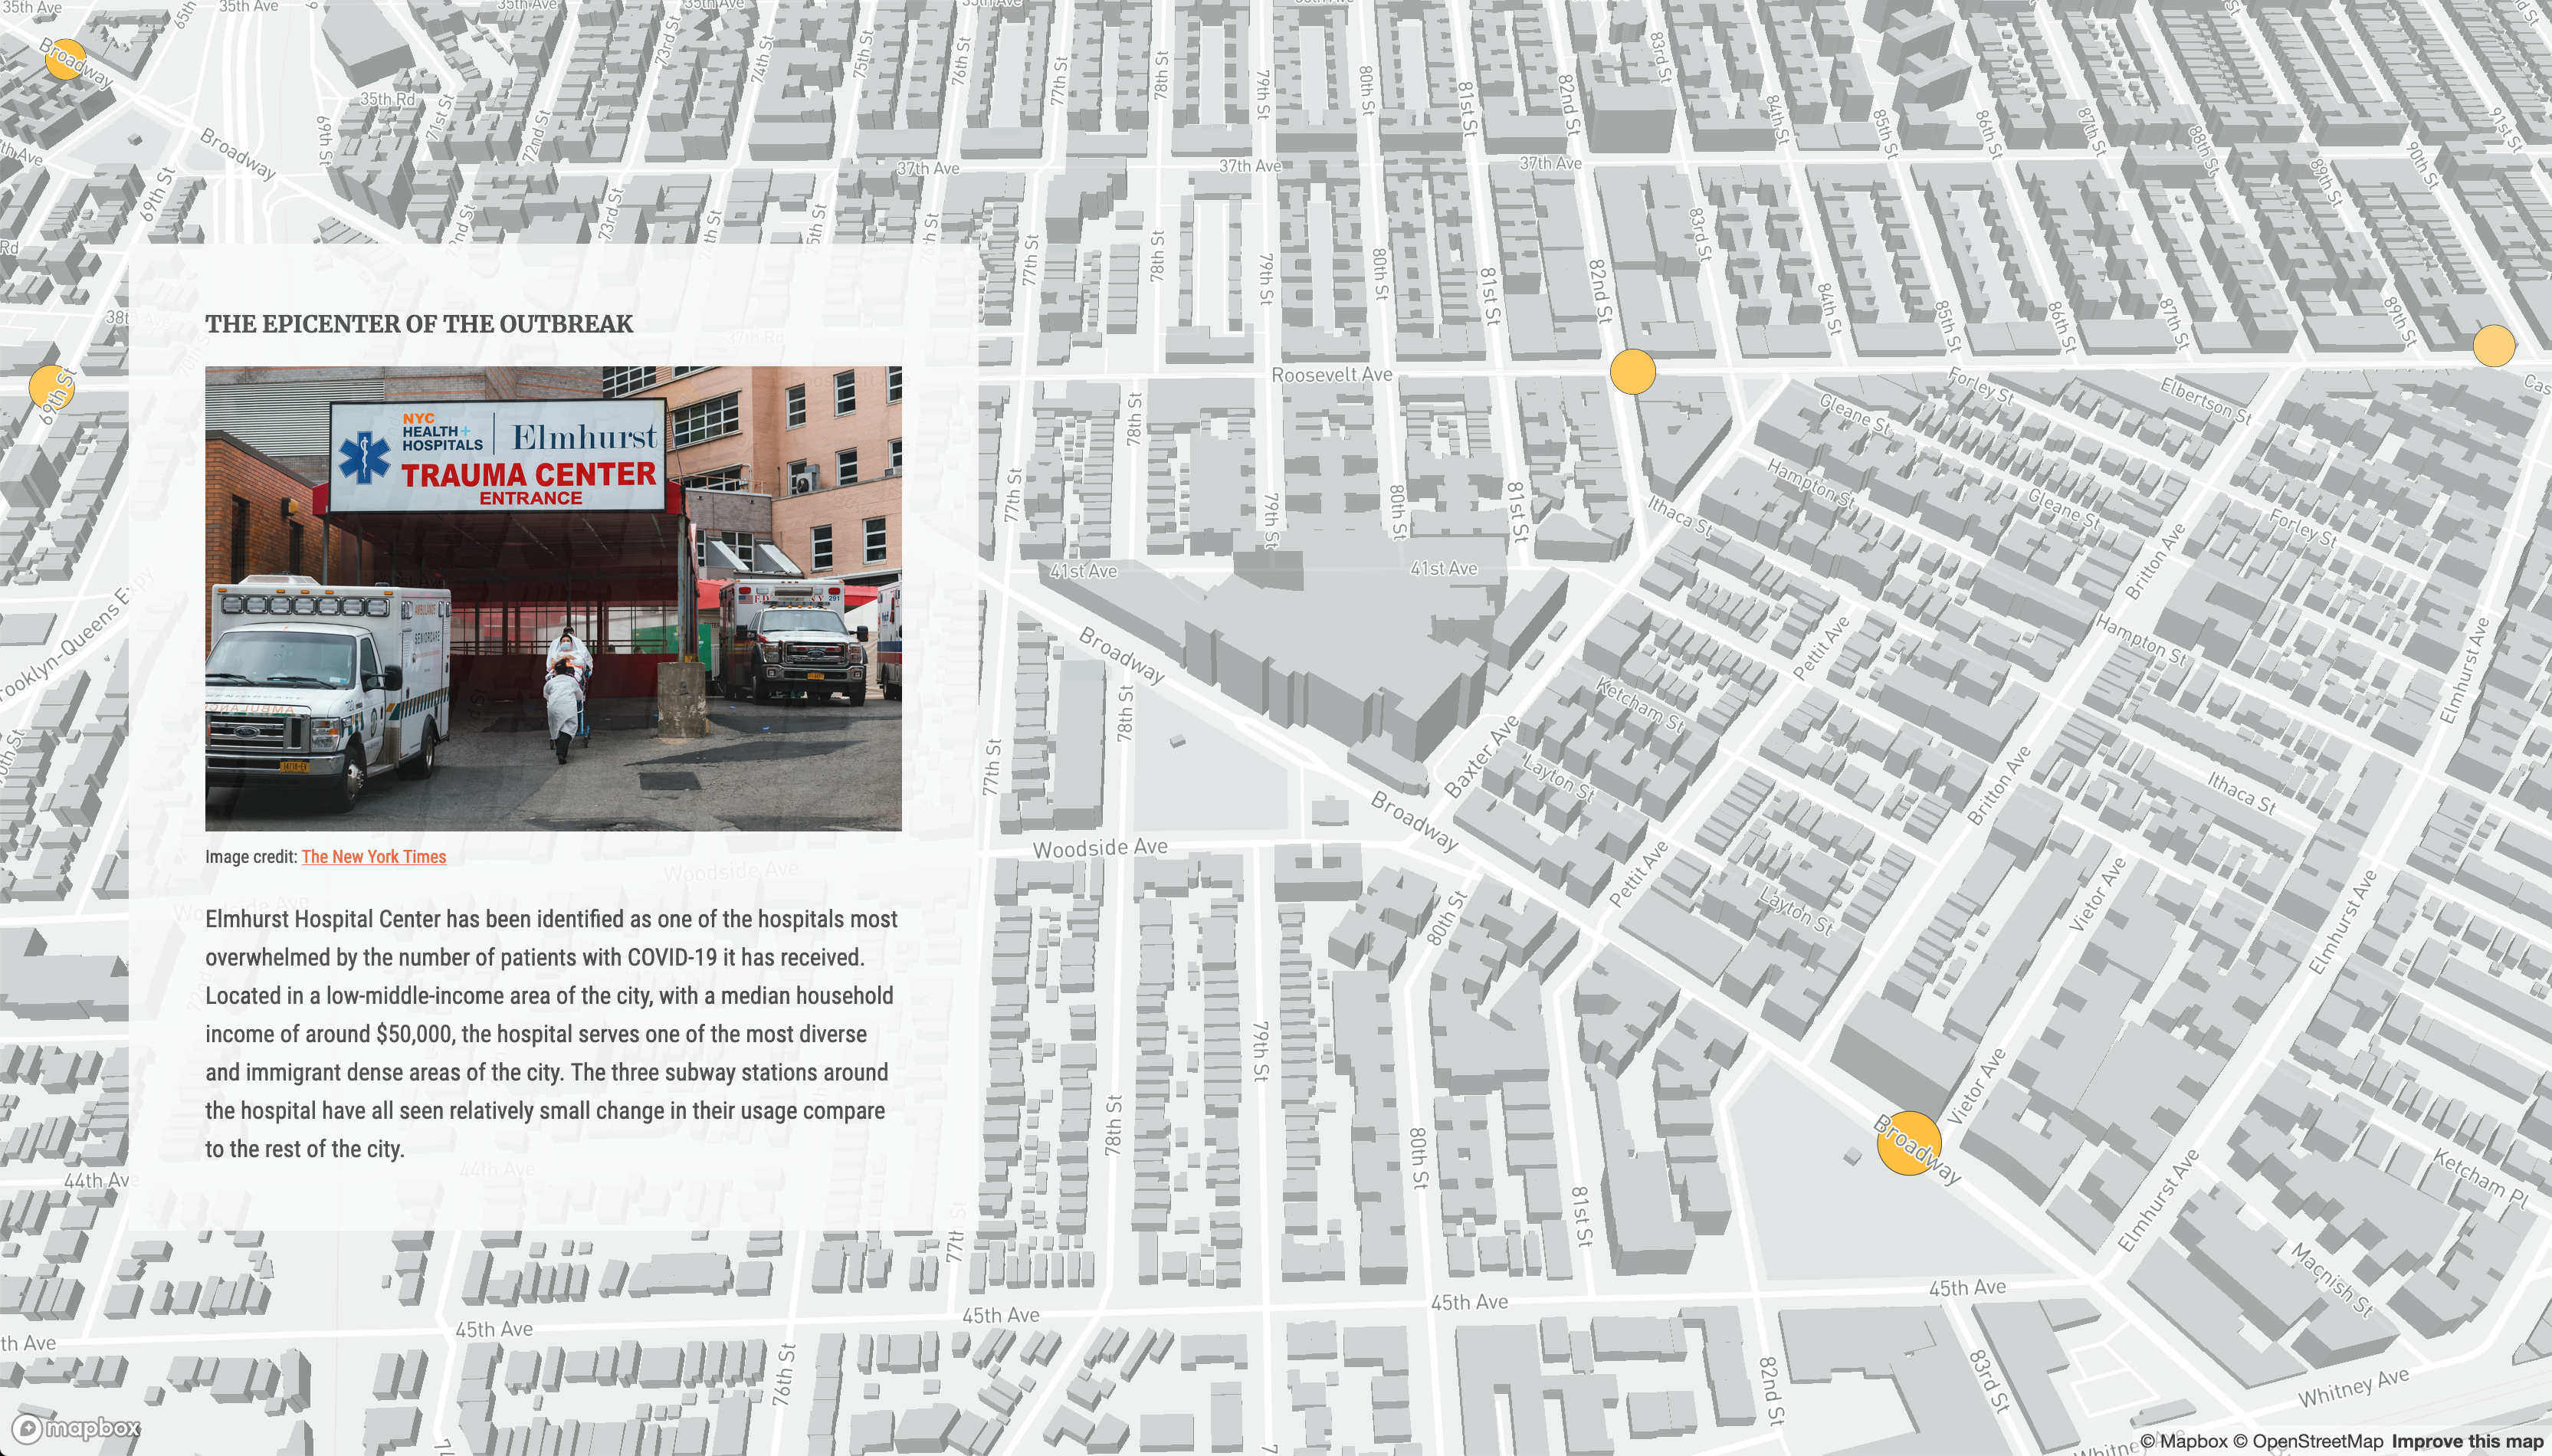
"<h3>The epicenter of the outbreak</h3>" +
'<img src="images/Chapter_3_Image.jpg">' +
'<p class="imageCredit"><a href="https://www.nytimes.com/2020/04/09/nyregion/coronavirus-queens-corona-jackson-heights-elmhurst.html">The New York Times</a></p>' +
"<p>Elmhurst Hospital Center has been identified as one of the hospitals most overwhelmed by the number of patients with COVID-19 it has received. Located in a low-middle-income area of the city, with a median household income of around $50,000, the hospital serves one of the most diverse and immigrant dense areas of the city. The three subway stations around the hospital have all seen relatively small change in their usage compare to the rest of the city.</p>";
let divChapter4 =
"<h3 style='max-width:600px; margin-left:auto; margin-right:auto'>Overall collapse of subway usage</h3>" +
'<div style="max-width:1200px; margin-left:auto; margin-right:auto"><img src="images/WeekdaySubway.svg"></div>' +
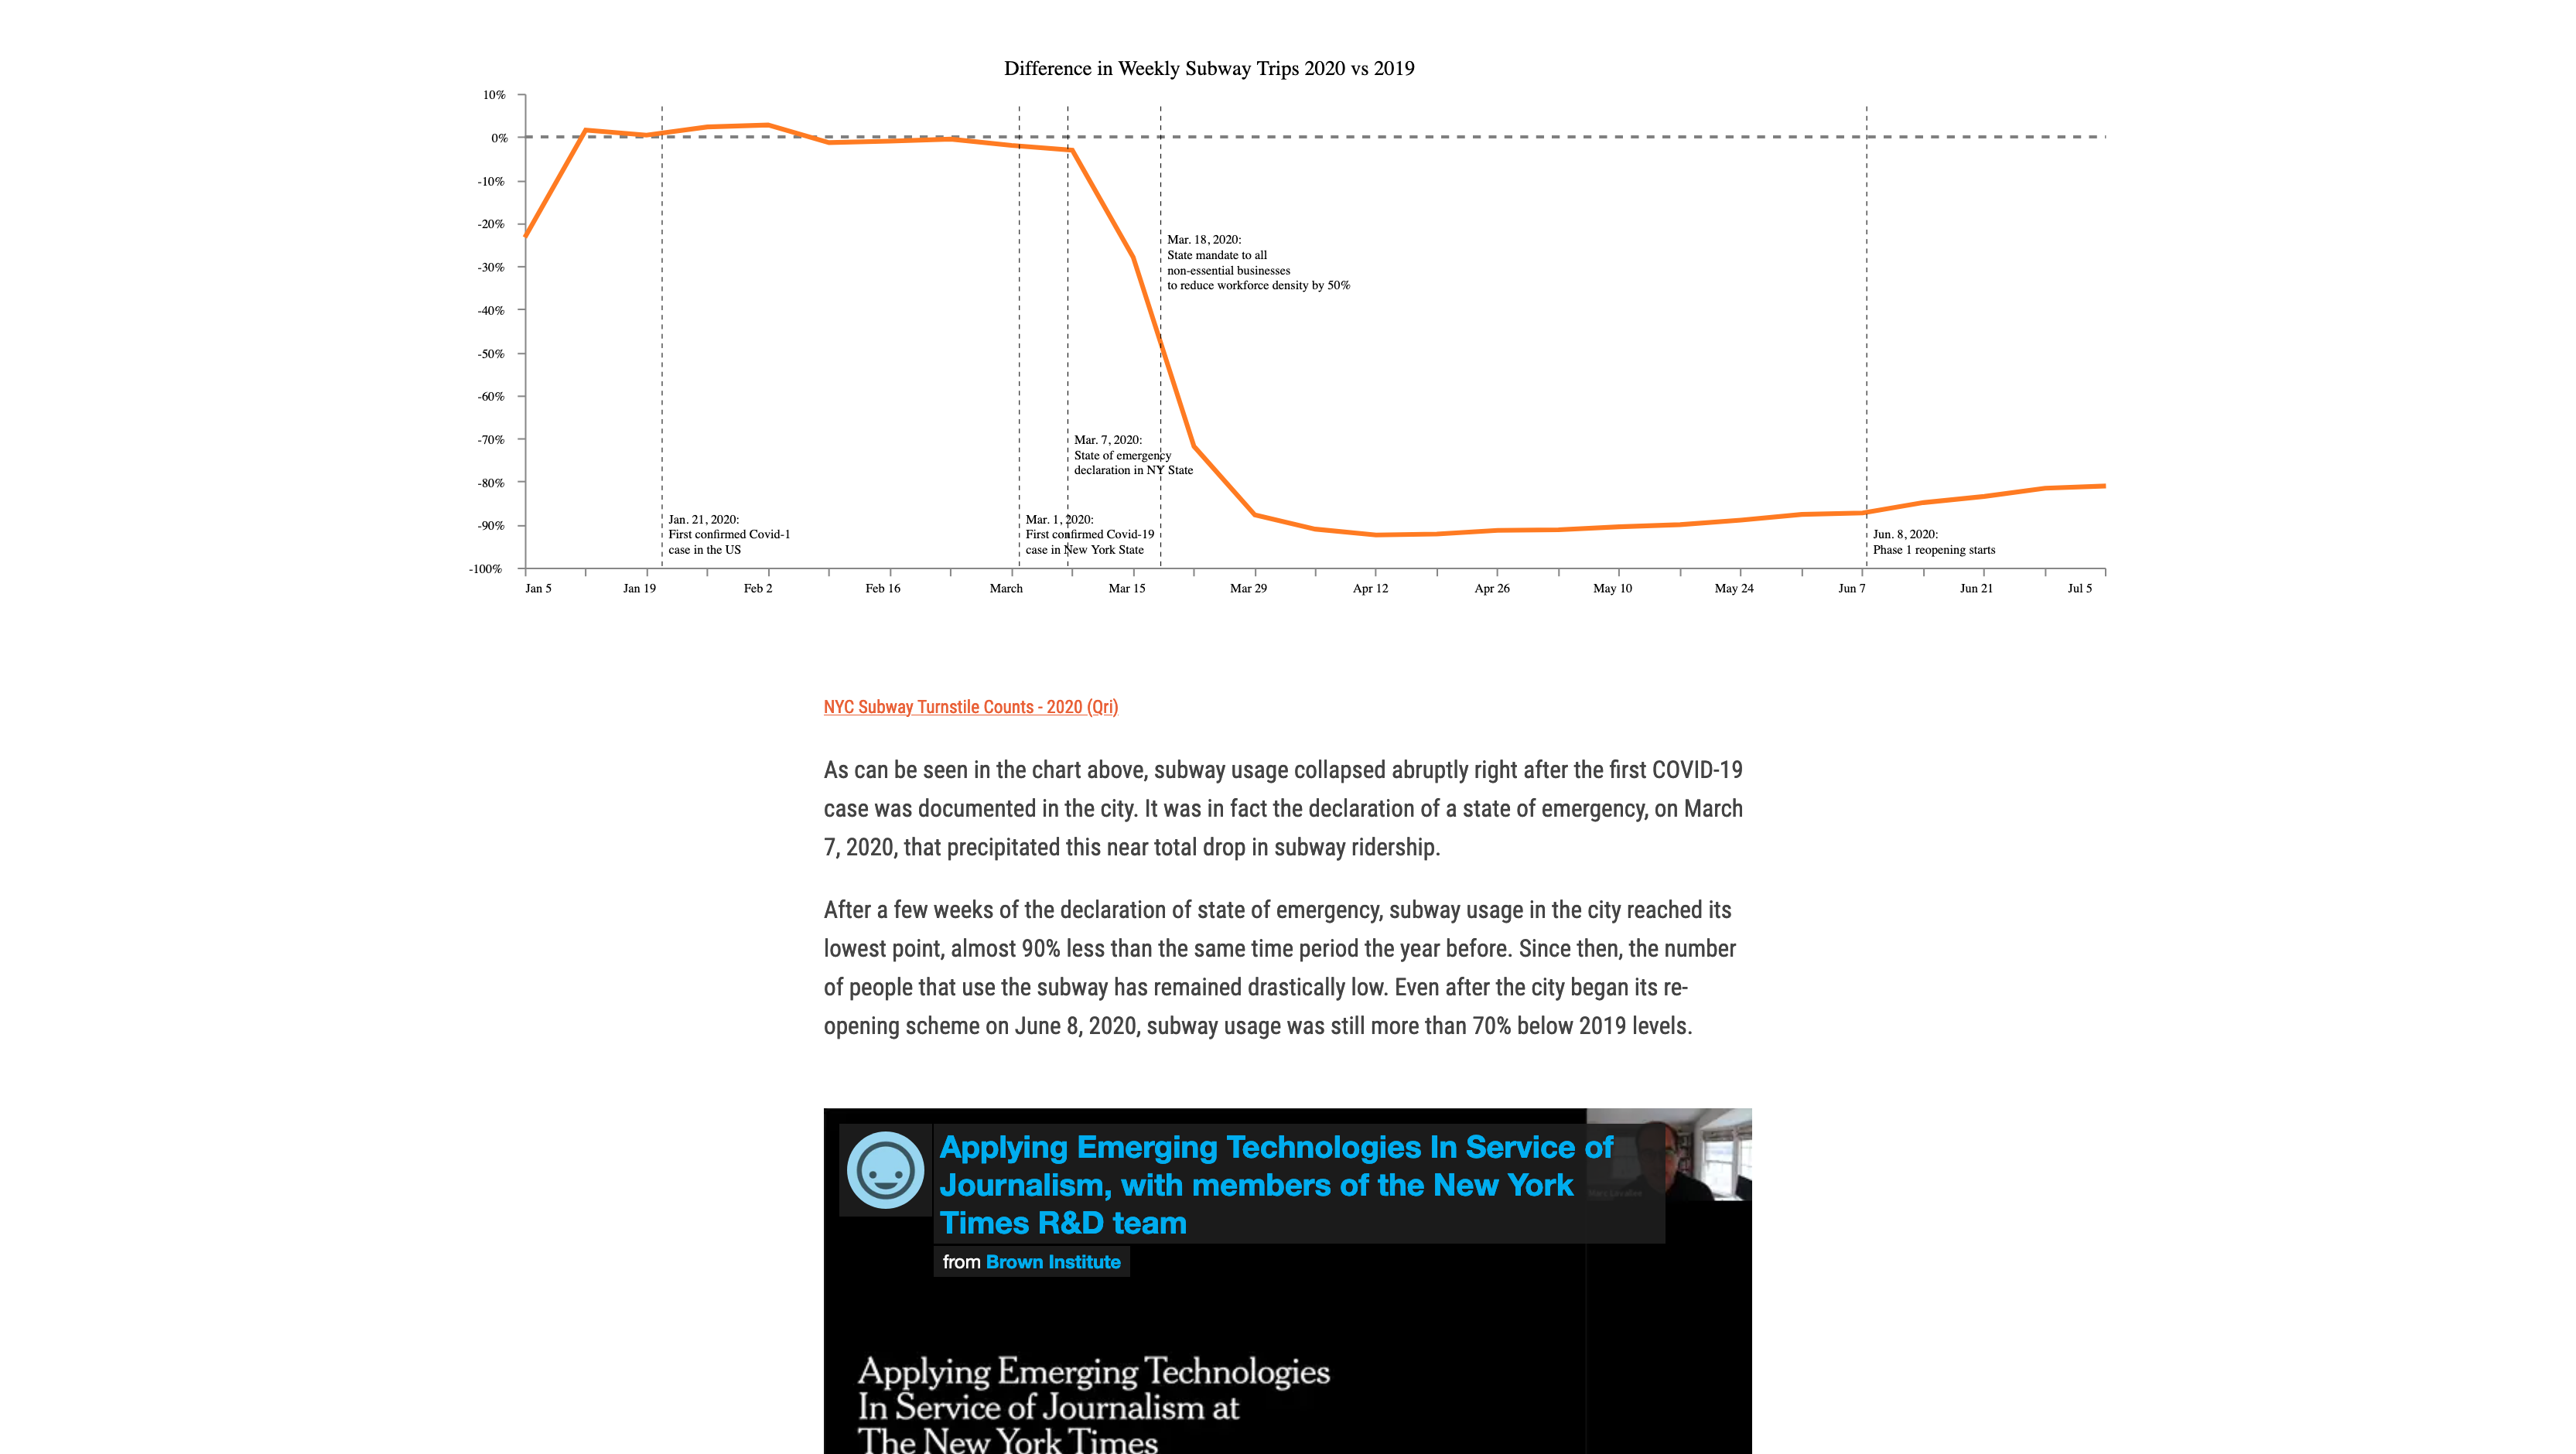
"<p class='imageCredit' style='max-width:600px; margin-left:auto; margin-right:auto'><a href='https://qri.cloud/nyc-transit-data/turnstile_daily_counts_2020'>NYC Subway Turnstile Counts - 2020 (Qri)</a></p>" +
"<p style='max-width:600px; margin-left:auto; margin-right:auto'>As can be seen in the chart above, subway usage collapsed abruptly right after the first COVID-19 case was documented in the city. It was in fact the declaration of a state of emergency, on March 7, 2020, that precipitated this near total drop in subway ridership.</p>" +
"<p style='max-width:600px; margin-left:auto; margin-right:auto'>After a few weeks of the declaration of state of emergency, subway usage in the city reached its lowest point, almost 90% less than the same time period the year before. Since then, the number of people that use the subway has remained drastically low. Even after the city began its re-opening scheme on June 8, 2020, subway usage was still more than 70% below 2019 levels.</p>" +
'<div style="max-width:600px; margin-left:auto; margin-right:auto"><iframe title="vimeo-player" src="https://player.vimeo.com/video/529512696" width="600" height="277.5" frameborder="0" allowfullscreen></iframe></div>' +
"<p style='max-width:600px; margin-left:auto; margin-right:auto'>This difference, however, varies across the city, with some parts of it seeing a much steeper decline and others witnessing a stronger recovery. Nevertheless, even a year after the pandemic first hit New York City, the number of daily subway commuters remains below 2019 levels.</p>" +
"<p style='max-width:600px; margin-left:auto; margin-right:auto'>That being said, other transportation networks have fared differently. For example, after a similar decline right after the state of emergency was declared, Citibike has seen its number of users reach and even surpass 2019 levels. City buses, on the other hand, also remain underutilized compared to their usage pre-pandemic.</p>";
let divChapter5 =
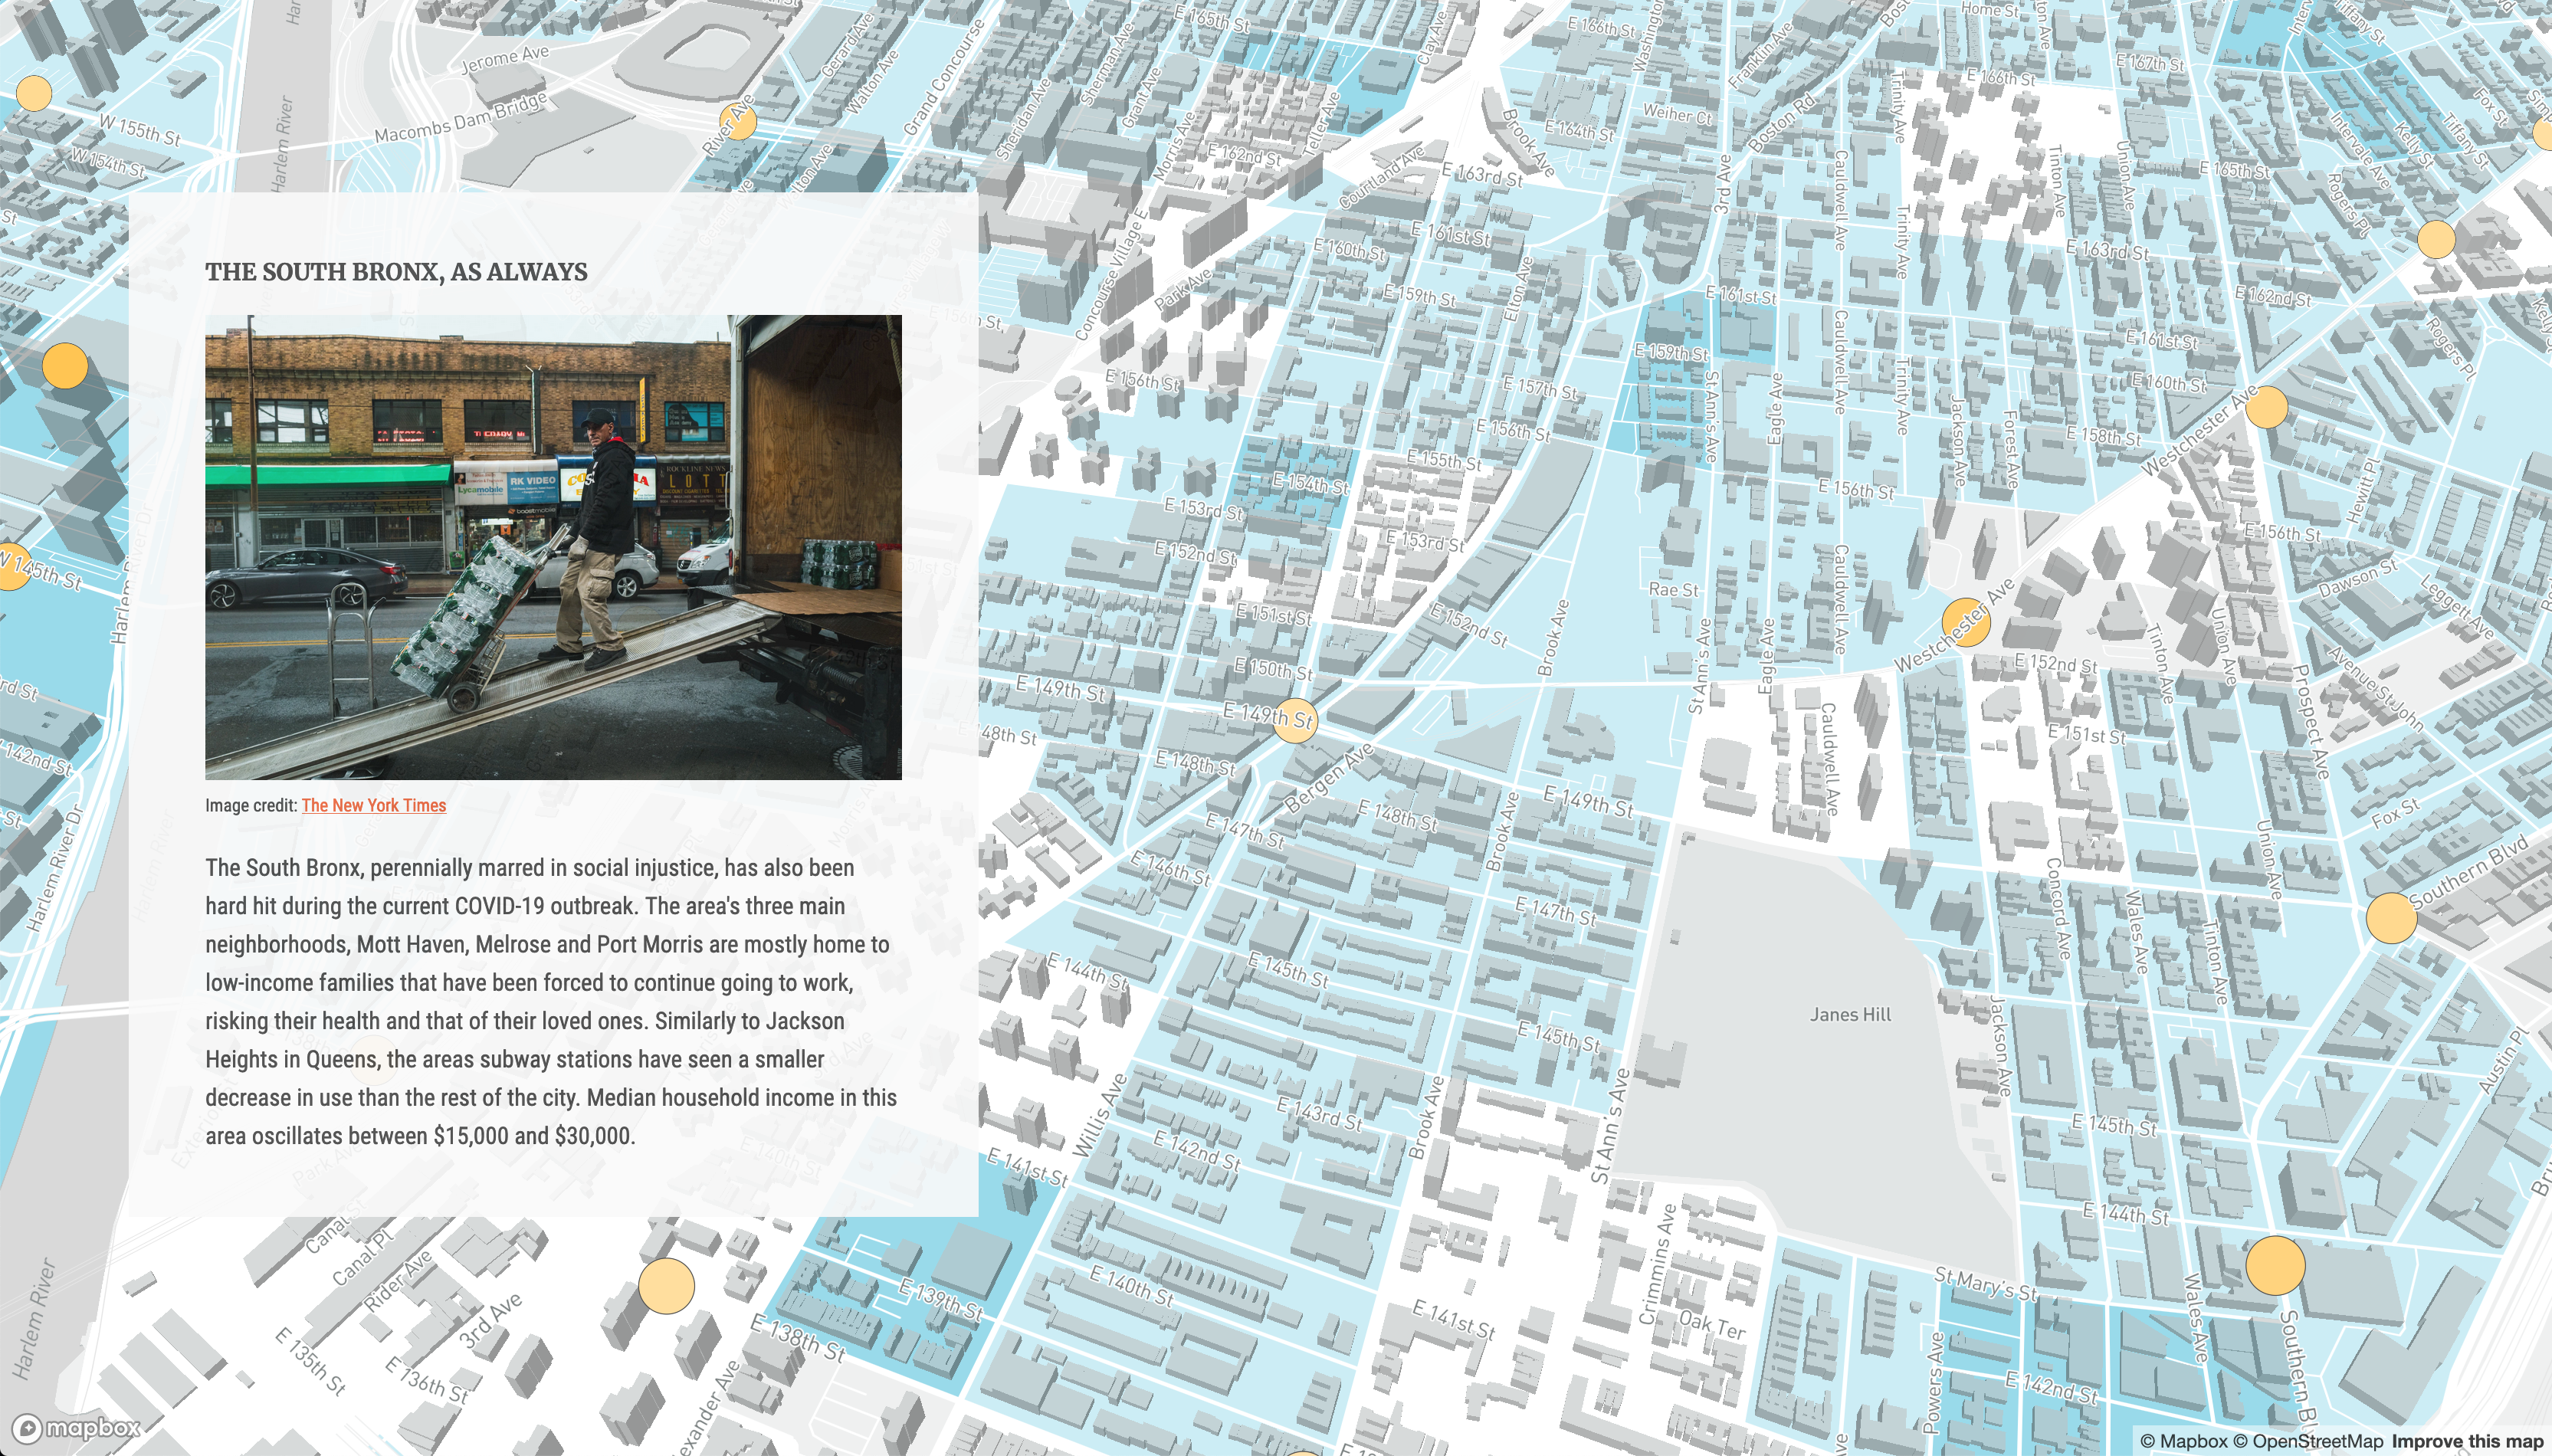
"<h3>The South Bronx, as Always</h3>" +
'<img src="images/Chapter_4_Image.jpg">' +
'<p class="imageCredit"><a href="https://www.nytimes.com/2020/04/09/nyregion/coronavirus-queens-corona-jackson-heights-elmhurst.html">The New York Times</a></p>' +
"<p>The South Bronx, perennially marred in social injustice, has also been hard hit during the current COVID-19 outbreak. The area's three main neighborhoods, Mott Haven, Melrose and Port Morris are mostly home to low-income families that have been forced to continue going to work, risking their health and that of their loved ones. Similarly to Jackson Heights in Queens, the areas subway stations have seen a smaller decrease in use than the rest of the city. Median household income in this area oscillates between $15,000 and $30,000.</p>";
var config = {
style: "*** Your Mapbox style URL here ***",
accessToken: "*** Your Mapbox access token here ***",
showMarkers: false,
markerColor: "#3FB1CE",
theme: "light",
use3dTerrain: false,
topTitle: topTitleDiv,
title: titleDiv,
subtitle: "",
byline: bylineDiv,
description: descriptionDiv,
footer: footerDiv,
chapters: [
{
id: "overallMap",
alignment: "left",
hidden: false,
chapterDiv: divChapter1,
location: {
center: [-74, 40.725],
zoom: 10,
zoomSmall: 9,
pitch: 0,
bearing: 0,
},
mapAnimation: "flyTo",
rotateAnimation: false,
callback: "",
onChapterEnter: [],
onChapterExit: [],
},
{
id: "incomeUnderlay",
alignment: "left",
hidden: false,
title: "",
image: "",
description: "",
chapterDiv: divChapter2,
location: {
center: [-74, 40.725],
zoom: 10,
zoomSmall: 9,
pitch: 0,
bearing: 0,
},
mapAnimation: "flyTo",
rotateAnimation: false,
callback: "",
onChapterEnter: [
{
layer: "medianIncome",
opacity: 1,
duration: 300,
},
],
onChapterExit: [
{
layer: "medianIncome",
opacity: 0,
duration: 300,
},
],
},
{
id: "elmhurstHospital",
alignment: "left",
hidden: false,
title: "",
image: "",
description: "",
chapterDiv: divChapter3,
location: {
center: [-73.886201, 40.744566],
zoom: 16,
zoomSmall: 14,
pitch: 40,
bearing: -7,
},
mapAnimation: "flyTo",
rotateAnimation: false,
callback: "",
onChapterEnter: [
{
layer: "medianIncome",
opacity: 0,
duration: 300,
},
],
onChapterExit: [
{
layer: "medianIncome",
opacity: 0,
duration: 300,
},
],
},
{
id: "weekdayTrips",
alignment: "full",
hidden: false,
title: "",
image: "",
description: "",
chapterDiv: divChapter4,
location: {
center: [-73.886201, 40.744566],
zoom: 16,
zoomSmall: 14,
pitch: 40,
bearing: -7,
},
mapAnimation: "flyTo",
rotateAnimation: false,
callback: "",
onChapterEnter: [
{
layer: "medianIncome",
opacity: 0,
duration: 300,
},
],
onChapterExit: [
{
layer: "medianIncome",
opacity: 0,
duration: 300,
},
],
},
{
id: "southBronx",
alignment: "right",
hidden: false,
title: "",
image: "",
description: "",
chapterDiv: divChapter5,
location: {
center: [-73.918037, 40.816093],
zoom: 15,
zoomSmall: 14,
pitch: 40,
bearing: 8,
},
mapAnimation: "flyTo",
rotateAnimation: false,
callback: "",
onChapterEnter: [
{
layer: "medianIncome",
opacity: 1,
duration: 300,
},
],
onChapterExit: [
{
layer: "medianIncome",
opacity: 0,
duration: 300,
},
],
},
],
};
If you reload your map this should not affect anything yet.
Modifying Your map.js File
All the functions that make the story run happen in the map.js file. Here’s the new full file with comments explaining what each of the section does. Make sure you read through the file to understand how it works.
/* First, define what constitutes a small screen.
This will affect the zoom parameter for each chapter. */

var smallMedia = window.matchMedia("(max-width: 600px)").matches;

/* Next, create two variables that will hold:
1. The different types of layers available to Mapbox and their
respective opacity attributes.
2. The possible alignments which could be applied to the vignettes.*/

var layerTypes = {
  fill: ["fill-opacity"],
  line: ["line-opacity"],
  circle: ["circle-opacity", "circle-stroke-opacity"],
  symbol: ["icon-opacity", "text-opacity"],
  raster: ["raster-opacity"],
  "fill-extrusion": ["fill-extrusion-opacity"],
  heatmap: ["heatmap-opacity"],
};

var alignments = {
  left: "lefty",
  center: "centered",
  right: "righty",
  full: "fully",
};

/* The next two functions help turn on and off individual
layers through their opacity attributes: The first one gets
the type of layer and the second one adjusts the layer's opacity */

function getLayerPaintType(layer) {
  var layerType = map.getLayer(layer).type;
  return layerTypes[layerType];
}

function setLayerOpacity(layer) {
  var paintProps = getLayerPaintType(layer.layer);
  paintProps.forEach(function (prop) {
    var options = {};
    if (layer.duration) {
      var transitionProp = prop + "-transition";
      options = { duration: layer.duration };
      map.setPaintProperty(layer.layer, transitionProp, options);
    }
    map.setPaintProperty(layer.layer, prop, layer.opacity, options);
  });
}

/* Next, these variables and functions create the story and vignette html
elements, and populate them with the content from the config.js file.
They also assign a css class to certain elements, also based on the
config.js file */

// Main 'story', 'features' and 'header' elements
var story = document.getElementById("story");
var features = document.createElement("div");
var header = document.createElement("div");
features.setAttribute("id", "features");

// If the content exists, then assign it to the 'header' element
// Note how each one of these are assigning 'innerHTML'
if (config.topTitle) {
  var topTitle = document.createElement("div");
  topTitle.innerHTML = config.topTitle;
  header.appendChild(topTitle);
}
if (config.title) {
  var titleText = document.createElement("div");
  titleText.innerHTML = config.title;
  header.appendChild(titleText);
}
if (config.subtitle) {
  var subtitleText = document.createElement("div");
  subtitleText.innerHTML = config.subtitle;
  header.appendChild(subtitleText);
}
if (config.byline) {
  var bylineText = document.createElement("div");
  bylineText.innerHTML = config.byline;
  header.appendChild(bylineText);
}
if (config.description) {
  var descriptionText = document.createElement("div");
  descriptionText.innerHTML = config.description;
  header.appendChild(descriptionText);
}

// If after this, the header has anything in it, it gets appended to the story
if (header.innerText.length > 0) {
  header.classList.add(config.theme);
  header.setAttribute("id", "header");
  story.appendChild(header);
}

/* After building the elements and assigning content to the header these
functions will loop through the chapters in the config.js file,
create the vignette elements and assign them their respective content */

config.chapters.forEach((record, idx) => {
  /* These first two variables will hold each vignette, the chapter
    element will go in the container element */
  var container = document.createElement("div");
  var chapter = document.createElement("div");
  // Adds a class to the vignette
  chapter.classList.add("br3");
  // Adds all the content to the vignette's div
  chapter.innerHTML = record.chapterDiv;
  // Sets the id for the vignette and adds the step css attribute
  container.setAttribute("id", record.id);
  container.classList.add("step");
  // If the chapter is the first one, set it to active
  if (idx === 0) {
    container.classList.add("active");
  }
  // Adds the overall theme to the chapter element
  chapter.classList.add(config.theme);
  /* Appends the chapter to the container element and the container
    element to the features element */
  container.appendChild(chapter);
  container.classList.add(alignments[record.alignment] || "centered");
  if (record.hidden) {
    container.classList.add("hidden");
  }
  features.appendChild(container);
});

// Appends the features element (with the vignettes) to the story element
story.appendChild(features);

/* Next, this section creates the footer element and assigns it
its content based on the config.js file */

var footer = document.createElement("div");

// This assigns all the content to the footer element
if (config.footer) {
  var footerText = document.createElement("p");
  footerText.innerHTML = config.footer;
  footer.appendChild(footerText);
}
// If the footer element contains any content, add it to the story
if (footer.innerText.length > 0) {
  footer.classList.add(config.theme);
  footer.setAttribute("id", "footer");
  story.appendChild(footer);
}

// Adds the Mapbox access token
mapboxgl.accessToken = config.accessToken;

// Honestly, don't know what this does
const transformRequest = (url) => {
  const hasQuery = url.indexOf("?") !== -1;
  const suffix = hasQuery
    ? "&pluginName=scrollytellingV2"
    : "?pluginName=scrollytellingV2";
  return {
    url: url + suffix,
  };
};

// Creates a variable to hold the starting zoom value
var startingZoom;
// If the screen size is small, it uses the `zoomSmall` value
if (smallMedia) {
  startingZoom = config.chapters[0].location.zoomSmall;
} else {
  startingZoom = config.chapters[0].location.zoom;
}

/* This section creates the map element with the
attributes from the main section of the config.js file */
var map = new mapboxgl.Map({
  container: "map",
  style: config.style,
  center: config.chapters[0].location.center,
  zoom: startingZoom,
  bearing: config.chapters[0].location.bearing,
  pitch: config.chapters[0].location.pitch,
  interactive: false,
  transformRequest: transformRequest,
});

if (config.showMarkers) {
  var marker = new mapboxgl.Marker({ color: config.markerColor });
  marker.setLngLat(config.chapters[0].location.center).addTo(map);
}

// Instantiates the scrollama function
var scroller = scrollama();

/* Here we add the two extra layers we are using, just like in our previous
tutorial. At the end, however, we setup the functions that will tie the
scrolling to the chapters and move the map from one location to another
while changing the zoom level, pitch and bearing */

map.on("load", function () {
  // Add 3d terrain if necessary
  if (config.use3dTerrain) {
    map.addSource("mapbox-dem", {
      type: "raster-dem",
      url: "mapbox://mapbox.mapbox-terrain-dem-v1",
      tileSize: 512,
      maxzoom: 14,
    });
    // Add the DEM source as a terrain layer with exaggerated height
    map.setTerrain({ source: "mapbox-dem", exaggeration: 1.5 });

    // Add a sky layer that will show when the map is highly pitched
    map.addLayer({
      id: "sky",
      type: "sky",
      paint: {
        "sky-type": "atmosphere",
        "sky-atmosphere-sun": [0.0, 0.0],
        "sky-atmosphere-sun-intensity": 15,
      },
    });
  }
  map.addLayer(
    {
      id: "turnstileData",
      type: "circle",
      source: {
        type: "geojson",
        data: "data/turnstileData.geojson",
      },
      paint: {
        "circle-color": [
          "interpolate",
          ["linear"],
          ["get", "ENTRIES_DIFF"],
          -1,
          "#ff4400",
          -0.7,
          "#ffba31",
          -0.4,
          "#ffffff",
        ],
        "circle-stroke-color": "#4d4d4d",
        "circle-stroke-width": 0.5,
        "circle-radius": [
          "interpolate",
          ["exponential", 2],
          ["zoom"],
          10,
          ["interpolate", ["linear"], ["get", "ENTRIES_DIFF"], -1, 10, -0.4, 1],
          15,
          [
            "interpolate",
            ["linear"],
            ["get", "ENTRIES_DIFF"],
            -1,
            25,
            -0.4,
            12,
          ],
        ],
      },
    },
    "road-label-simple"
  );
  map.addLayer(
    {
      id: "medianIncome",
      type: "fill",
      source: {
        type: "geojson",
        data: "data/medianIncome.geojson",
      },
      paint: {
        "fill-opacity": 0,
        "fill-color": [
          "step",
          ["get", "MHHI"],
          "#ffffff",
          20000,
          "#ccedf5",
          50000,
          "#99daea",
          75000,
          "#66c7e0",
          100000,
          "#33b5d5",
          150000,
          "#00a2ca",
        ],
      },
    },
    "waterway-shadow"
  );

  // Setup the instance, pass callback functions
  scroller
    .setup({
      step: ".step",
      offset: 0.75,
      progress: true,
    })
    .onStepEnter((response) => {
      var chapter = config.chapters.find(
        (chap) => chap.id === response.element.id
      );
      response.element.classList.add("active");
      let thisZoom;
      if (smallMedia) {
        thisZoom = chapter.location.zoomSmall;
      } else {
        thisZoom = chapter.location.zoom;
      }
      thisLocation = {
        bearing: chapter.location.bearing,
        center: chapter.location.center,
        pitch: chapter.location.pitch,
        zoom: thisZoom,
      };
      map[chapter.mapAnimation || "flyTo"](thisLocation);
      if (config.showMarkers) {
        marker.setLngLat(chapter.location.center);
      }
      if (chapter.onChapterEnter.length > 0) {
        chapter.onChapterEnter.forEach(setLayerOpacity);
      }
      if (chapter.callback) {
        window[chapter.callback]();
      }
      if (chapter.rotateAnimation) {
        map.once("moveend", function () {
          const rotateNumber = map.getBearing();
          map.rotateTo(rotateNumber + 90, {
            duration: 24000,
            easing: function (t) {
              return t;
            },
          });
        });
      }
    })
    .onStepExit((response) => {
      var chapter = config.chapters.find(
        (chap) => chap.id === response.element.id
      );
      response.element.classList.remove("active");
      if (chapter.onChapterExit.length > 0) {
        chapter.onChapterExit.forEach(setLayerOpacity);
      }
    });
});

/* Here we watch for any resizing of the screen to
adjust our scrolling setup */
window.addEventListener("resize", scroller.resize);
Note that when the content gets set into an html element, its done through a innerHTML, which adds actual html elements. These ones usually contain <p></p> tags as well as links (<a></a>).
At this point your map should work as a story guided by your scrolling. Here are a few images of the chapters:

Adding 3D Buildings to Your Mapbox Style
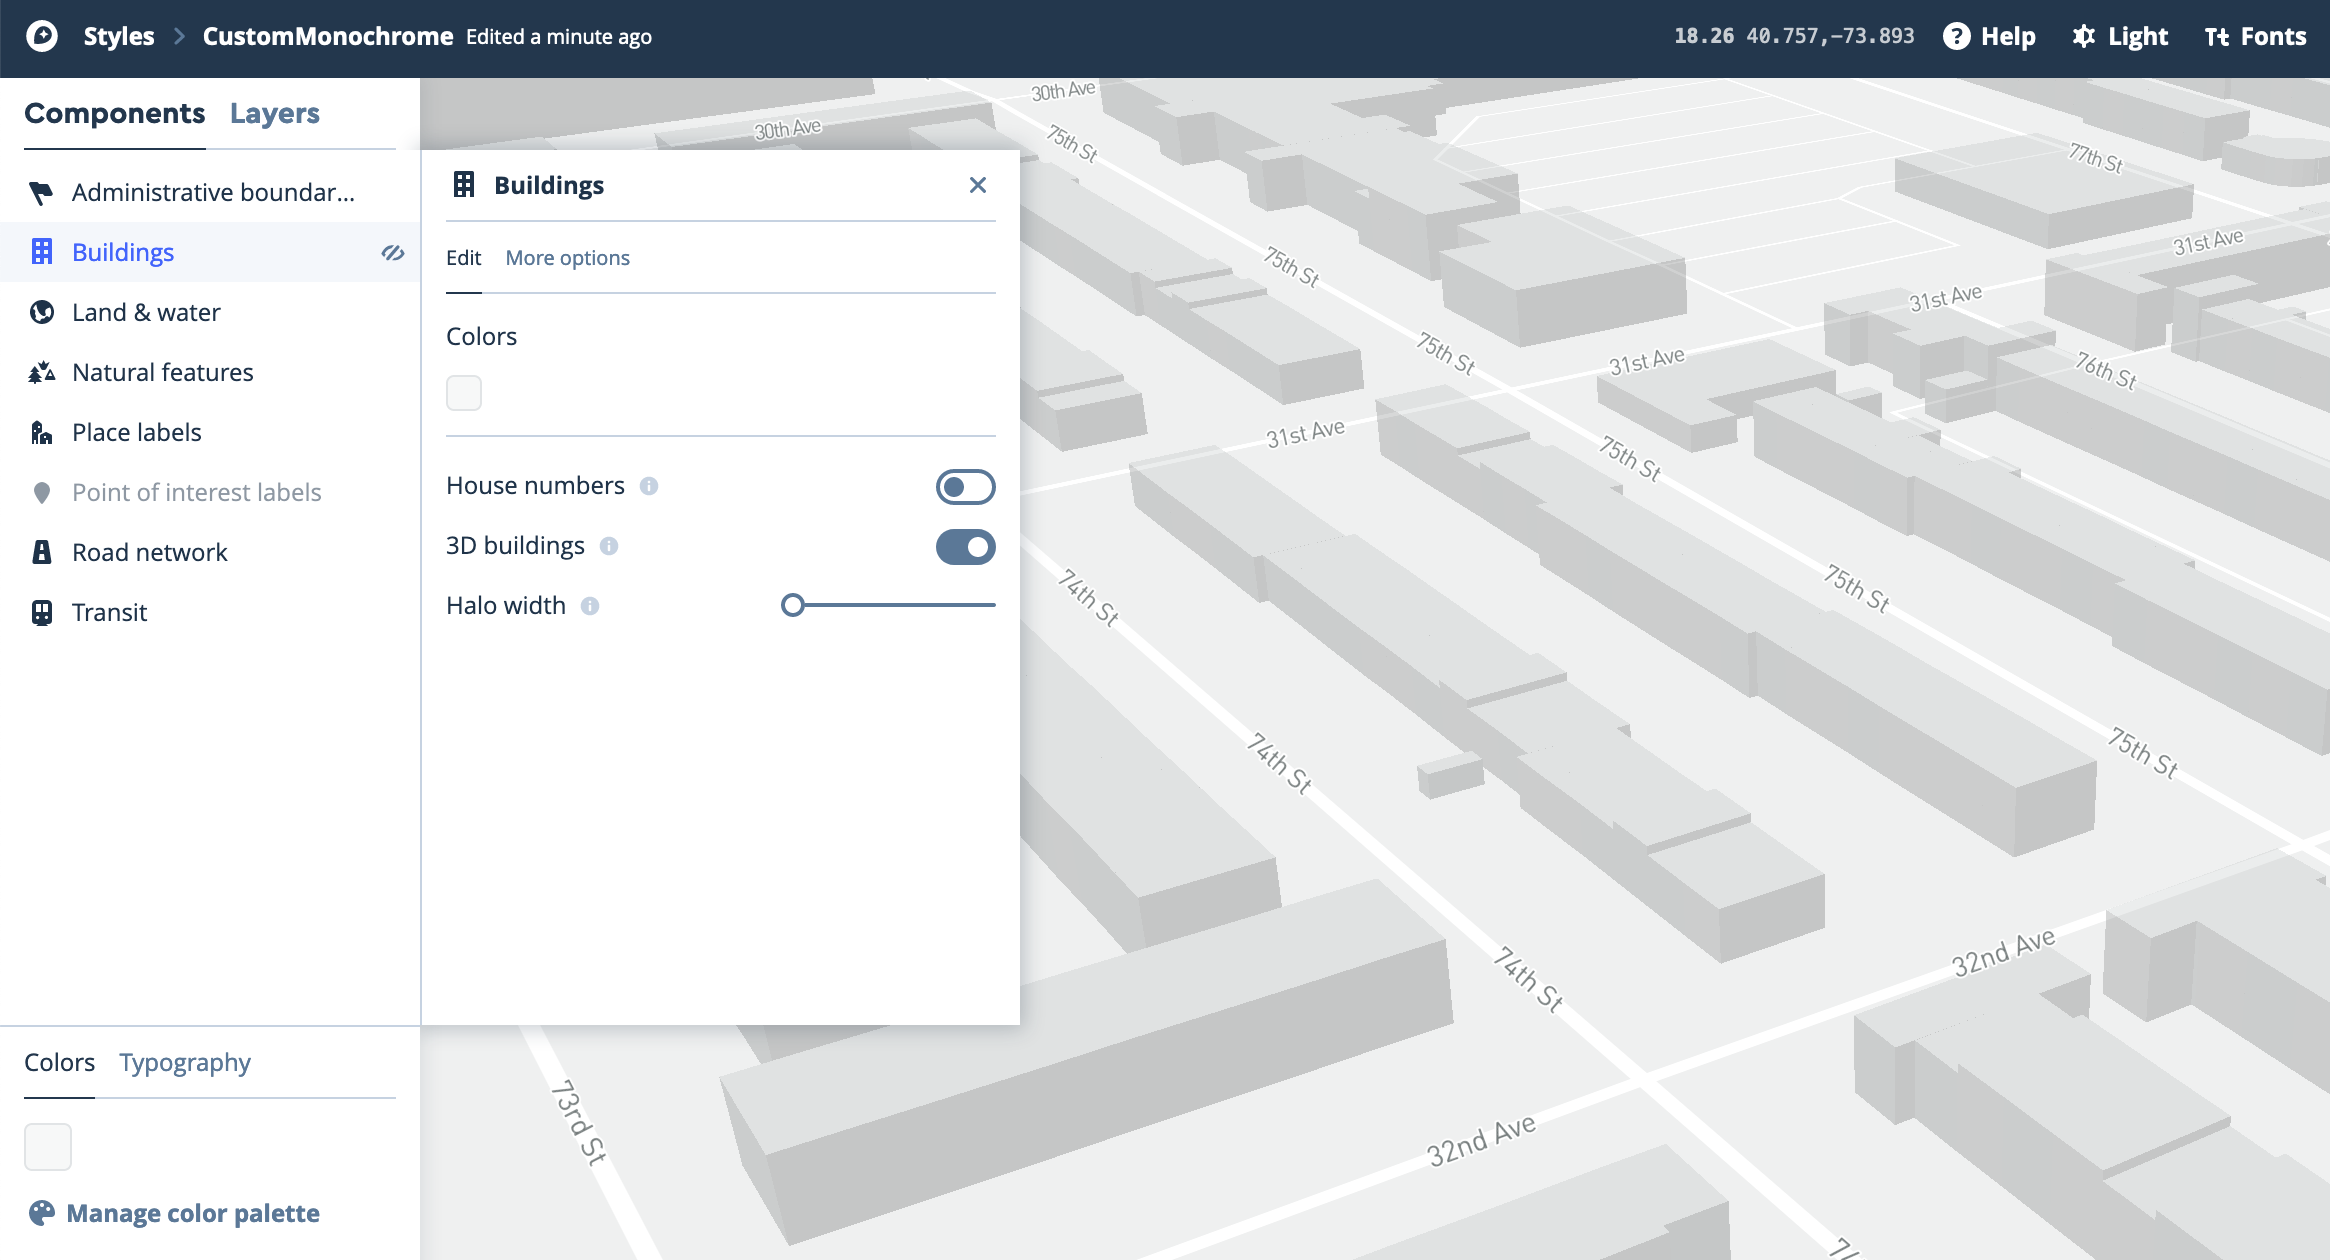
You probably noticed that the more zoomed-in scenes show 3D buildings. In order to display them you have to edit your Mapbox style. Go to your Mapbox Studio page and open the style you are using on your map.
Once you are there, click on the Components tab and select the Buildings components. There, click on the toggle to activate 3D buildings. To better see the result, press and hold the right-click on the map and move your mouse to change the pitch.
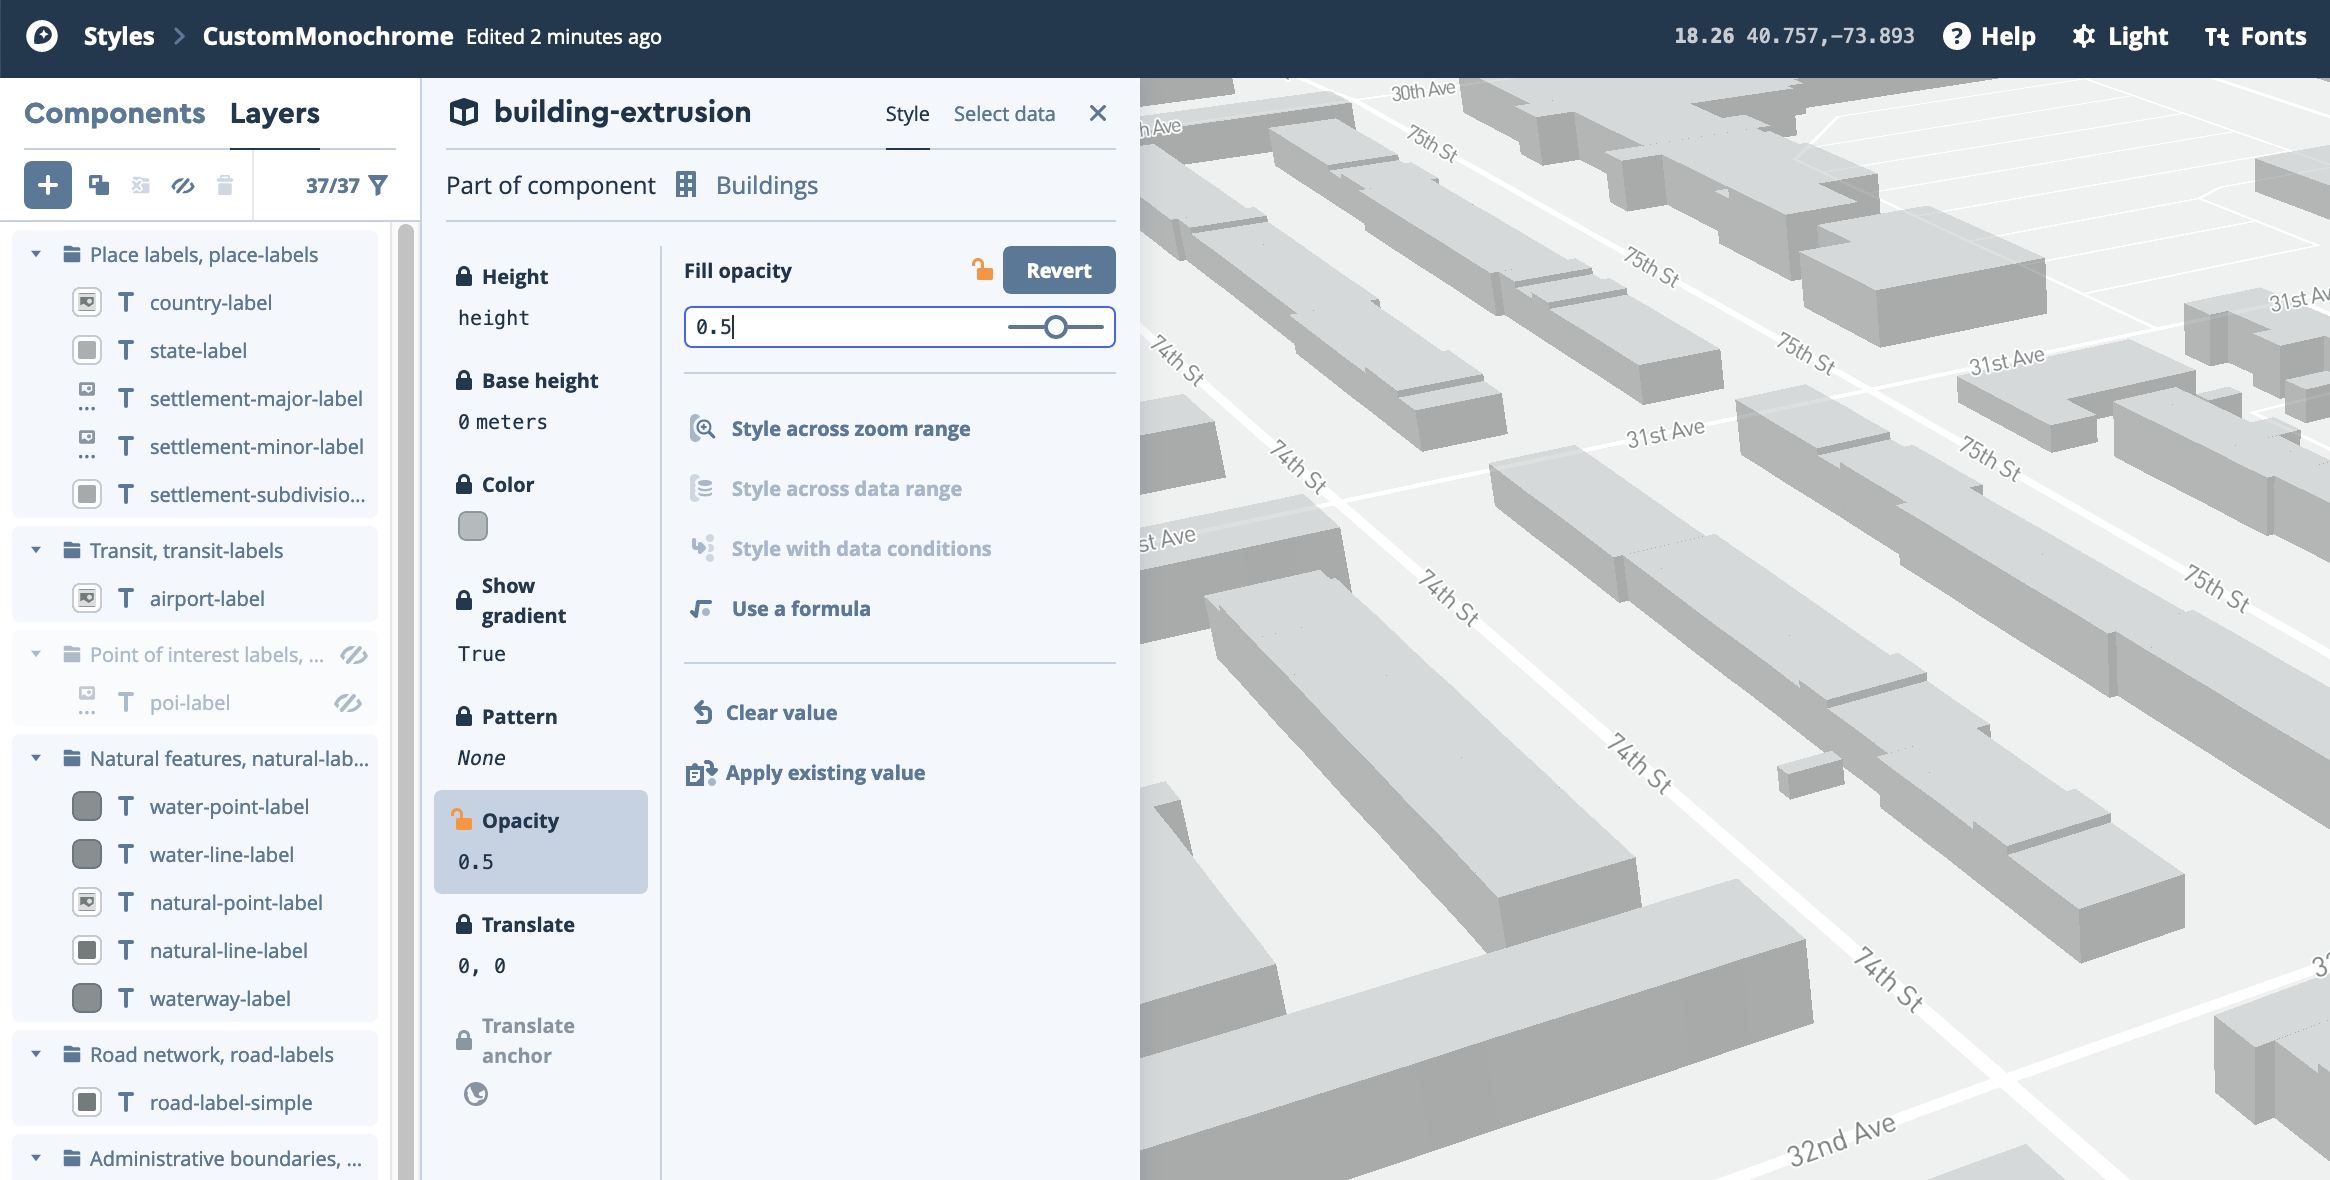
The 3D buildings will appear on the map but they might be too light. To change their opacity, go to the Layers pannel and select the Building extruded layer. There, select the Opacity option and click on the Override button. Change the Fill opacity to something closer to 0.5.
Finally, once you are done click on the Publish button on the top right-hand corner of your window and confirm you want to publish the map. Note that it might take a few minutes for your style to update on your storymap.
Uploading Your Project to Glitch
For your final assignment you will be uploading your project to Glitch, an online platform which describes itself as “A simple tool for creating web apps”.
The upload process is extremely easy. First, make sure you have an account. Once you have one, log in and click on the New Project button at the top of the page. Select the glitch-hello-website template.
This will bring up your new project page with five preset files and an assets folder (it’s not really a folder, but it works like one).
- The
README.mdfile works as the documentation for your project. This file will not affect your project in any way. - The
LICENSEfile describe the license under which this site is governed. This file will not affect your project either. - The
TODO.mdfile is basically a “todo” list. This is just a markdown file, which will not affect your site. - The
index.htmlfile works as it should, as the main landing page for your project. - The
script.jsfile is supposed to hold your JavaScript scripts. - The
style.cssfile is equivalent to ourstyles.cssfile.
Since we already have the files we need, you can go ahead and delete all these files except for the README.md. To delete them click on the three vertical dots at the right of the files and choose Delete![]() .
.
Next, you can just drag and drop your files to upload them to Glitch. I’ve had some problems dragging and dropping multiple files at once so better to do it one by one. You can’t upload folders so you’ll have to go into your images and data folders and drag and drop your geojson and image files.
Lastly, since Glitch doesn’t really have folders, the path to our geojson and image files won’t work. To get their location, click on each one of them, copy their new URL and go back to either the map.js or the config.js files (on Glitch) and replace their path with this new URL. Make sure you replace the full path.
Once you’ve added all the files and corrected the paths click on the Show button at the top-left. Your project should open there.
Finally, to invite others to collaborate on your project click on the Share dropdown menu and copy the URL under Invite Others to Edit.
Useful links
- Mapbox scrollytelling template’s official documentation.